Job openings reached their highest level in two years in May, hitting 7.594 million vacancies according to the latest Job Openings and Labor Turnover Survey (JOLTS). The latest reading was higher than the projected 7.280 million openings.
Key Takeaways
-
US job openings reached 7.594 million vacancies in May, exceeding the projected 7.280 million openings.
-
Unemployed workers totaled 7.307 million in May, resulting in 1.04 available jobs per unemployed worker.
From the press release:
The number of job openings was unchanged at 7.6 million in May, the U.S. Bureau of Labor Statistics reported today. Hires were unchanged at 5.2 million, while total separations changed little at 5.1 million. Within separations, quits (3.1 million) changed little, while layoffs and discharges (1.7 million) were unchanged.
Background on JOLTS (Job Openings and Labor Turnover)
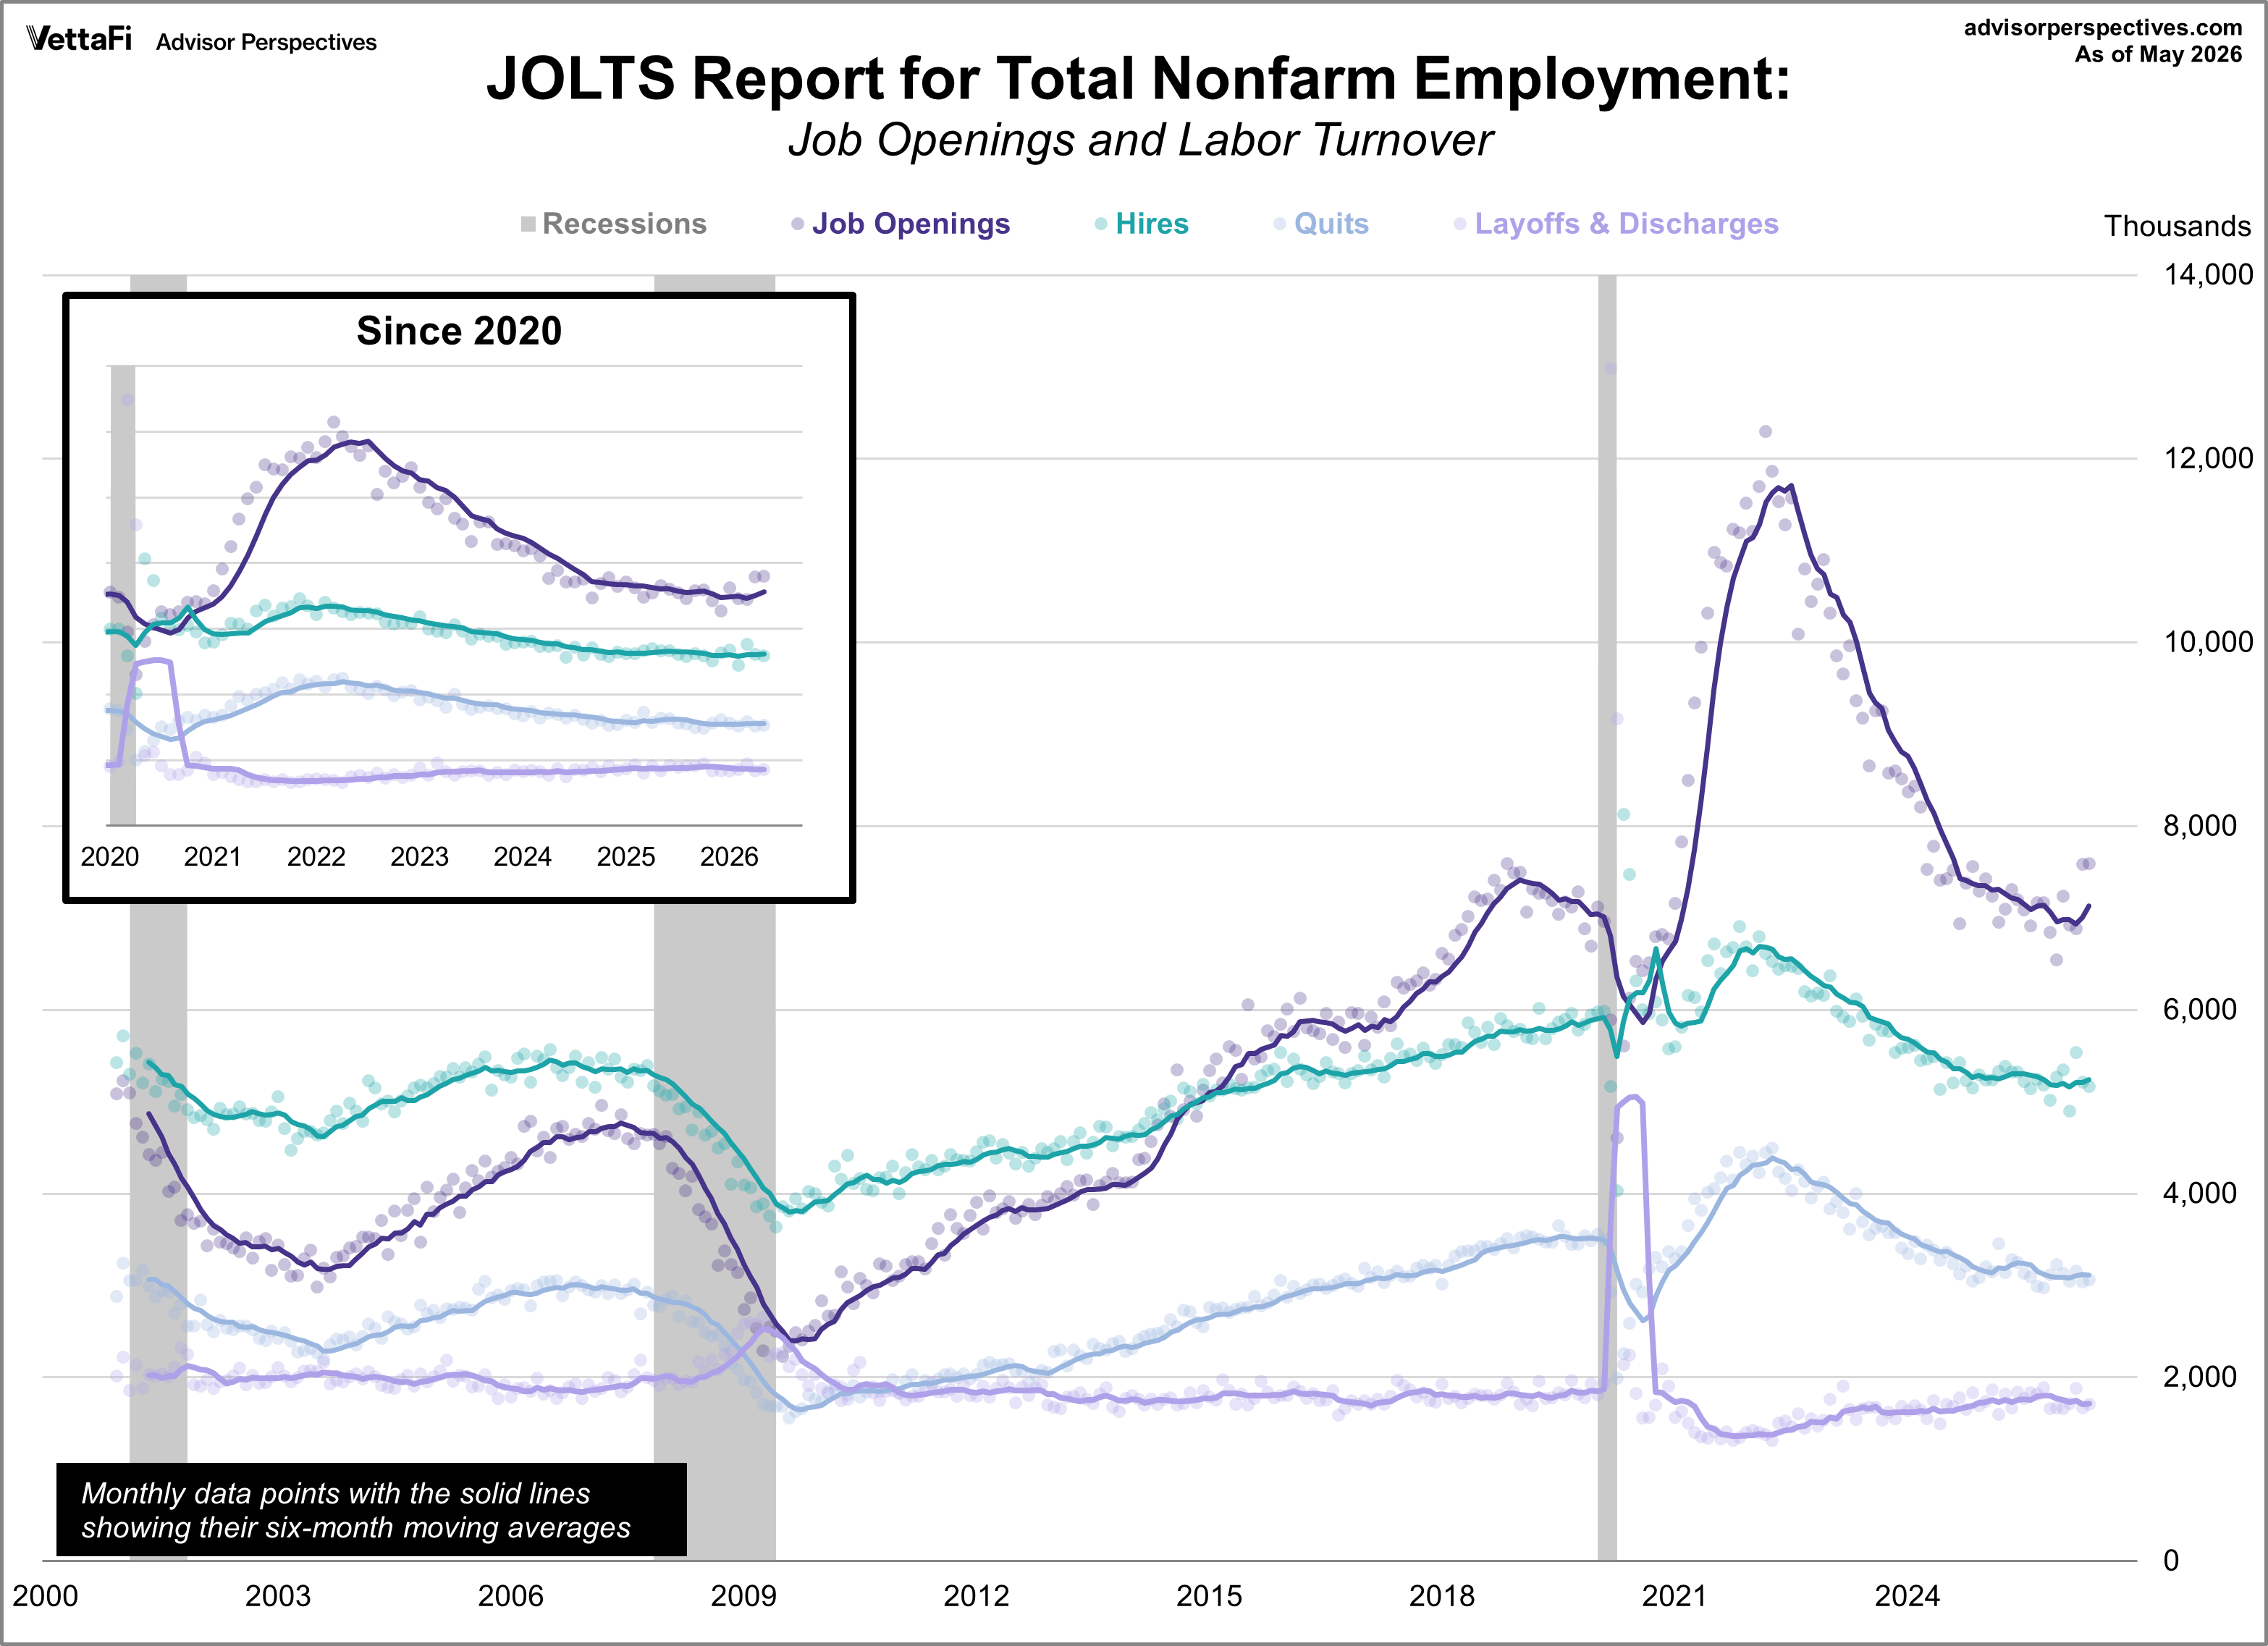
The JOLTS report is a monthly survey released by the BLS that tracks job openings, hiring, and separations (quits, layoffs, and discharges). Unlike the unemployment rate, which measures labor supply, JOLTS data helps gauge labor demand. An increase in job openings is generally a positive sign, indicating ample job opportunities.
The chart below displays the monthly data for the four components of the JOLTS series. Due to their volatility, six-month moving averages are included to highlight trends. The moving average for job openings remained above hires for over five years starting in 2015. It briefly dipped below hires in May and June 2020 but rebounded above in July 2020. From mid-2022 to September 2024, job openings, hires, and quits all declined, with job openings showing the steepest drop. However, since September 2024, hires and quits have stabilized. Meanwhile, job openings have continued their downward trend, while layoffs/discharges have gradually risen since mid-2022.

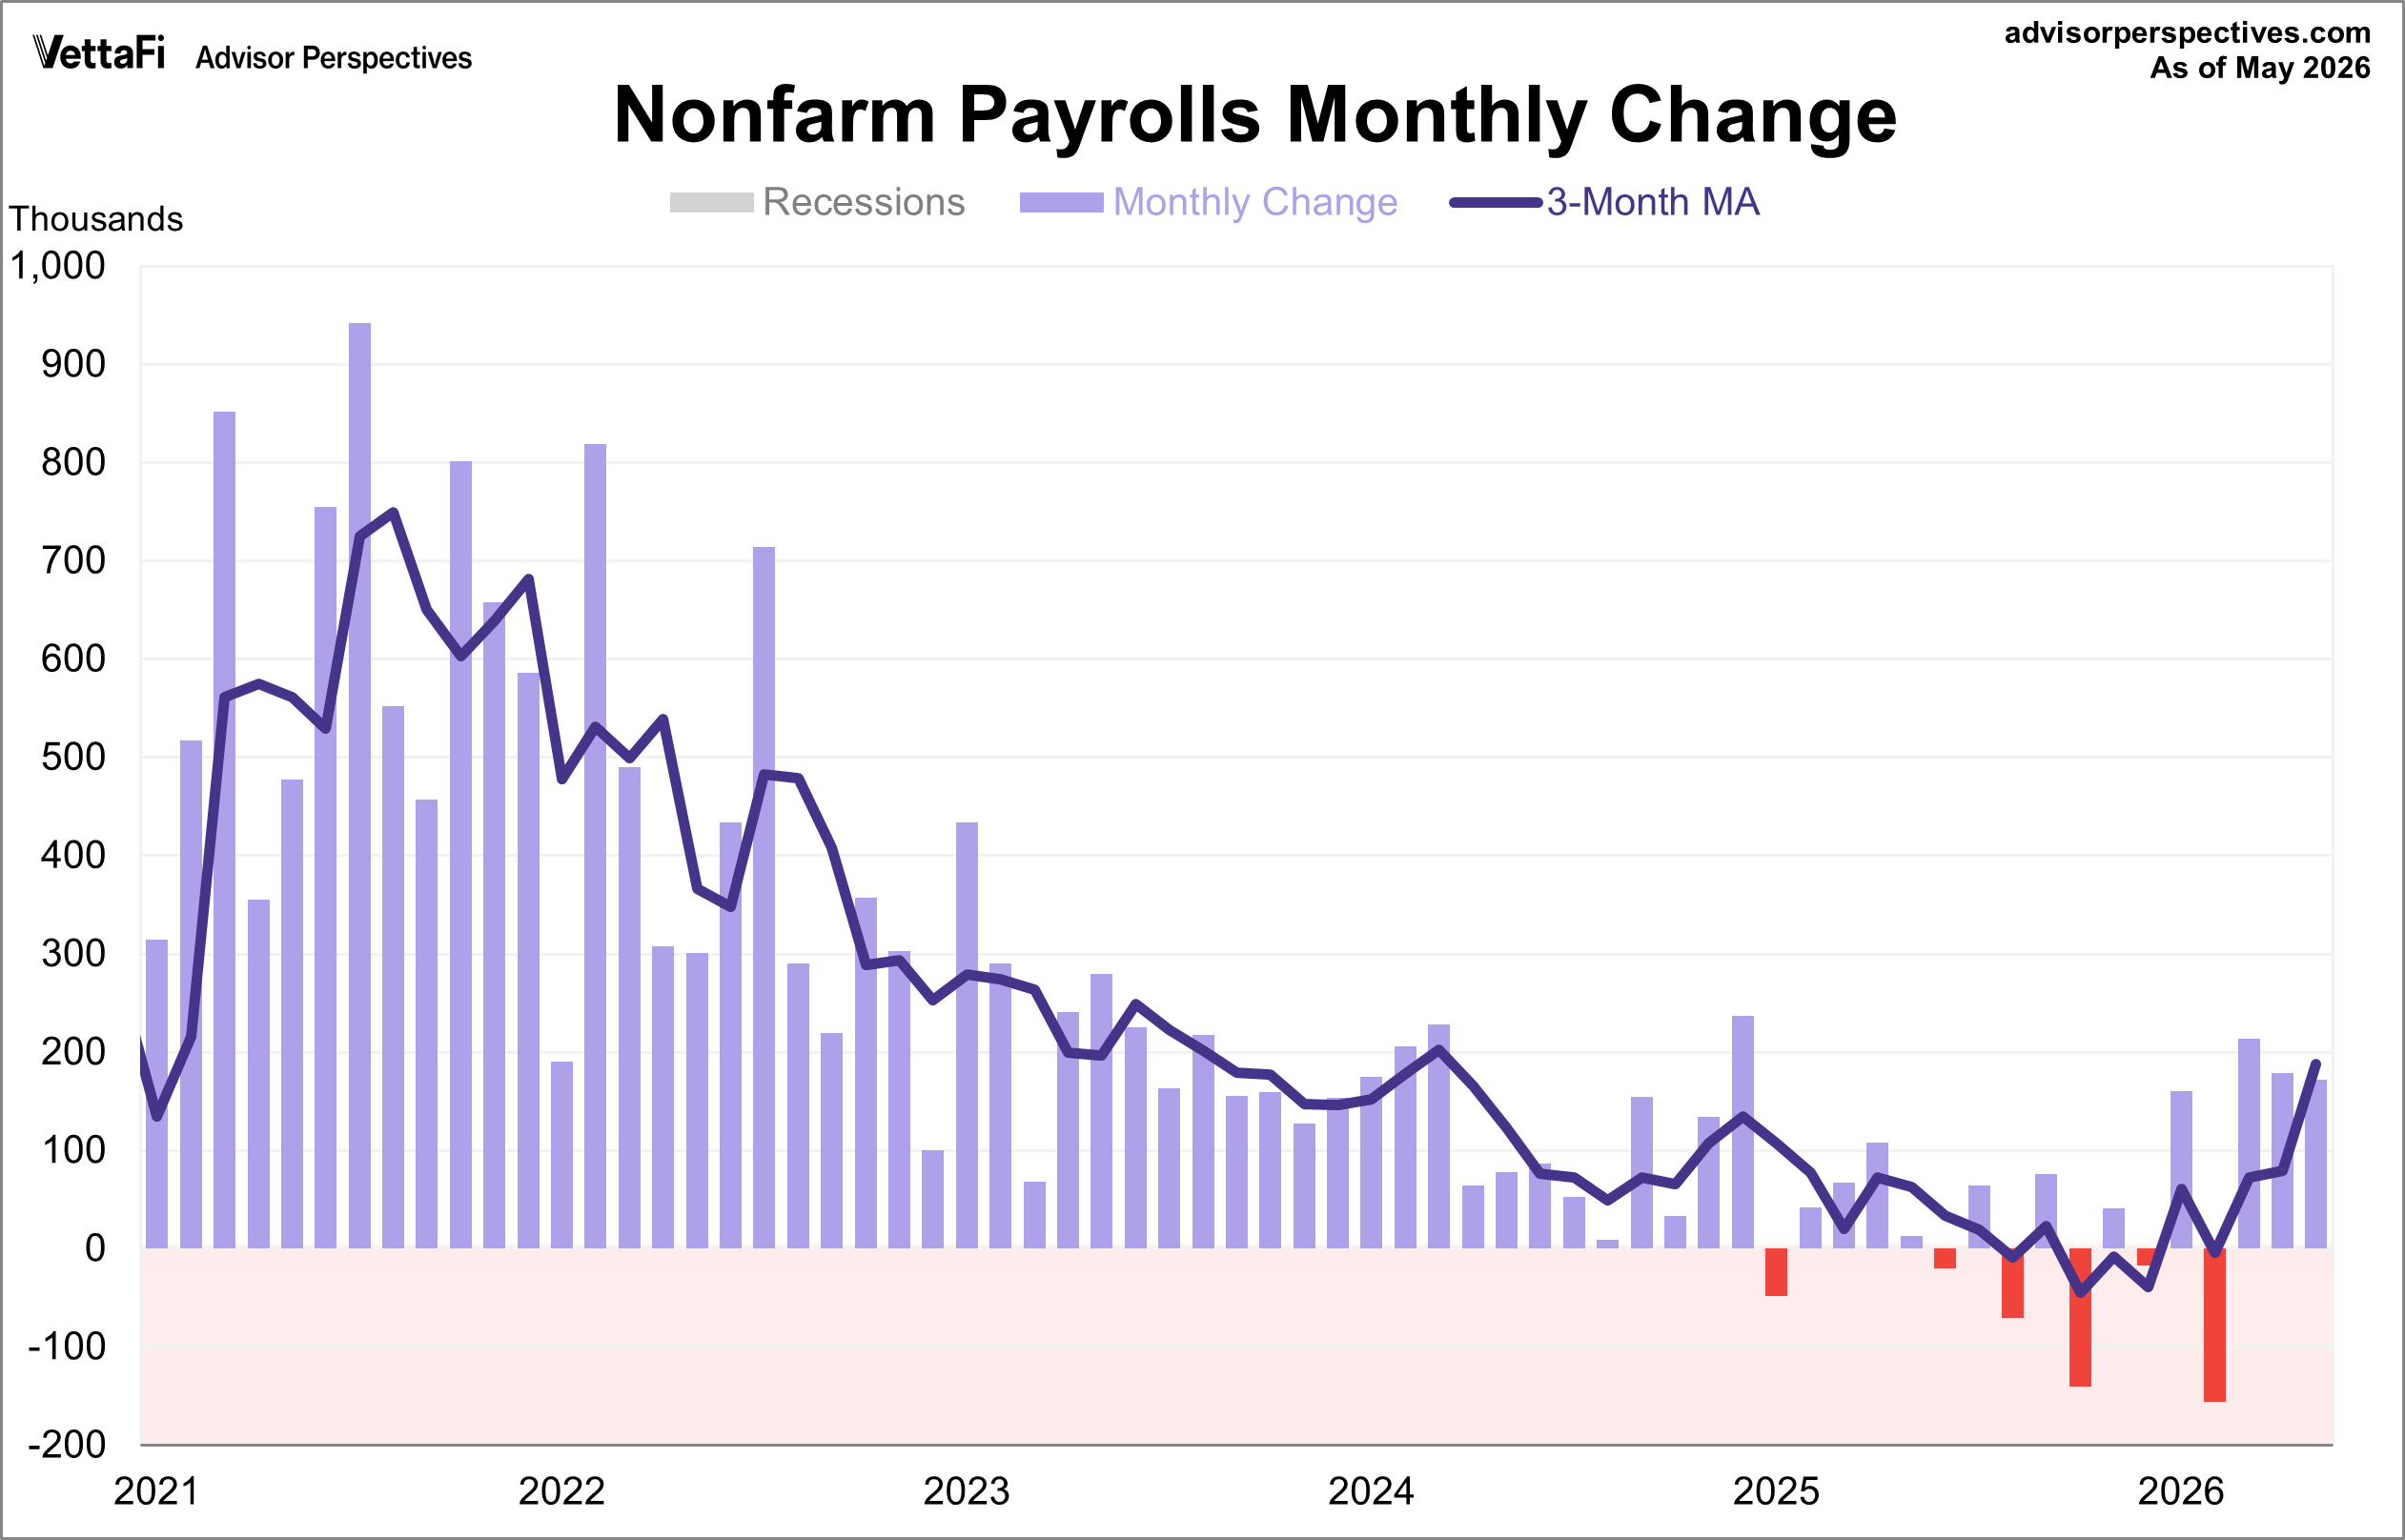
Jobs Report vs. JOLTS
JOLTS data lags the BLS employment report by one month. As a reminder, 172,000 jobs were added in May and the unemployment rate was at 4.3%.
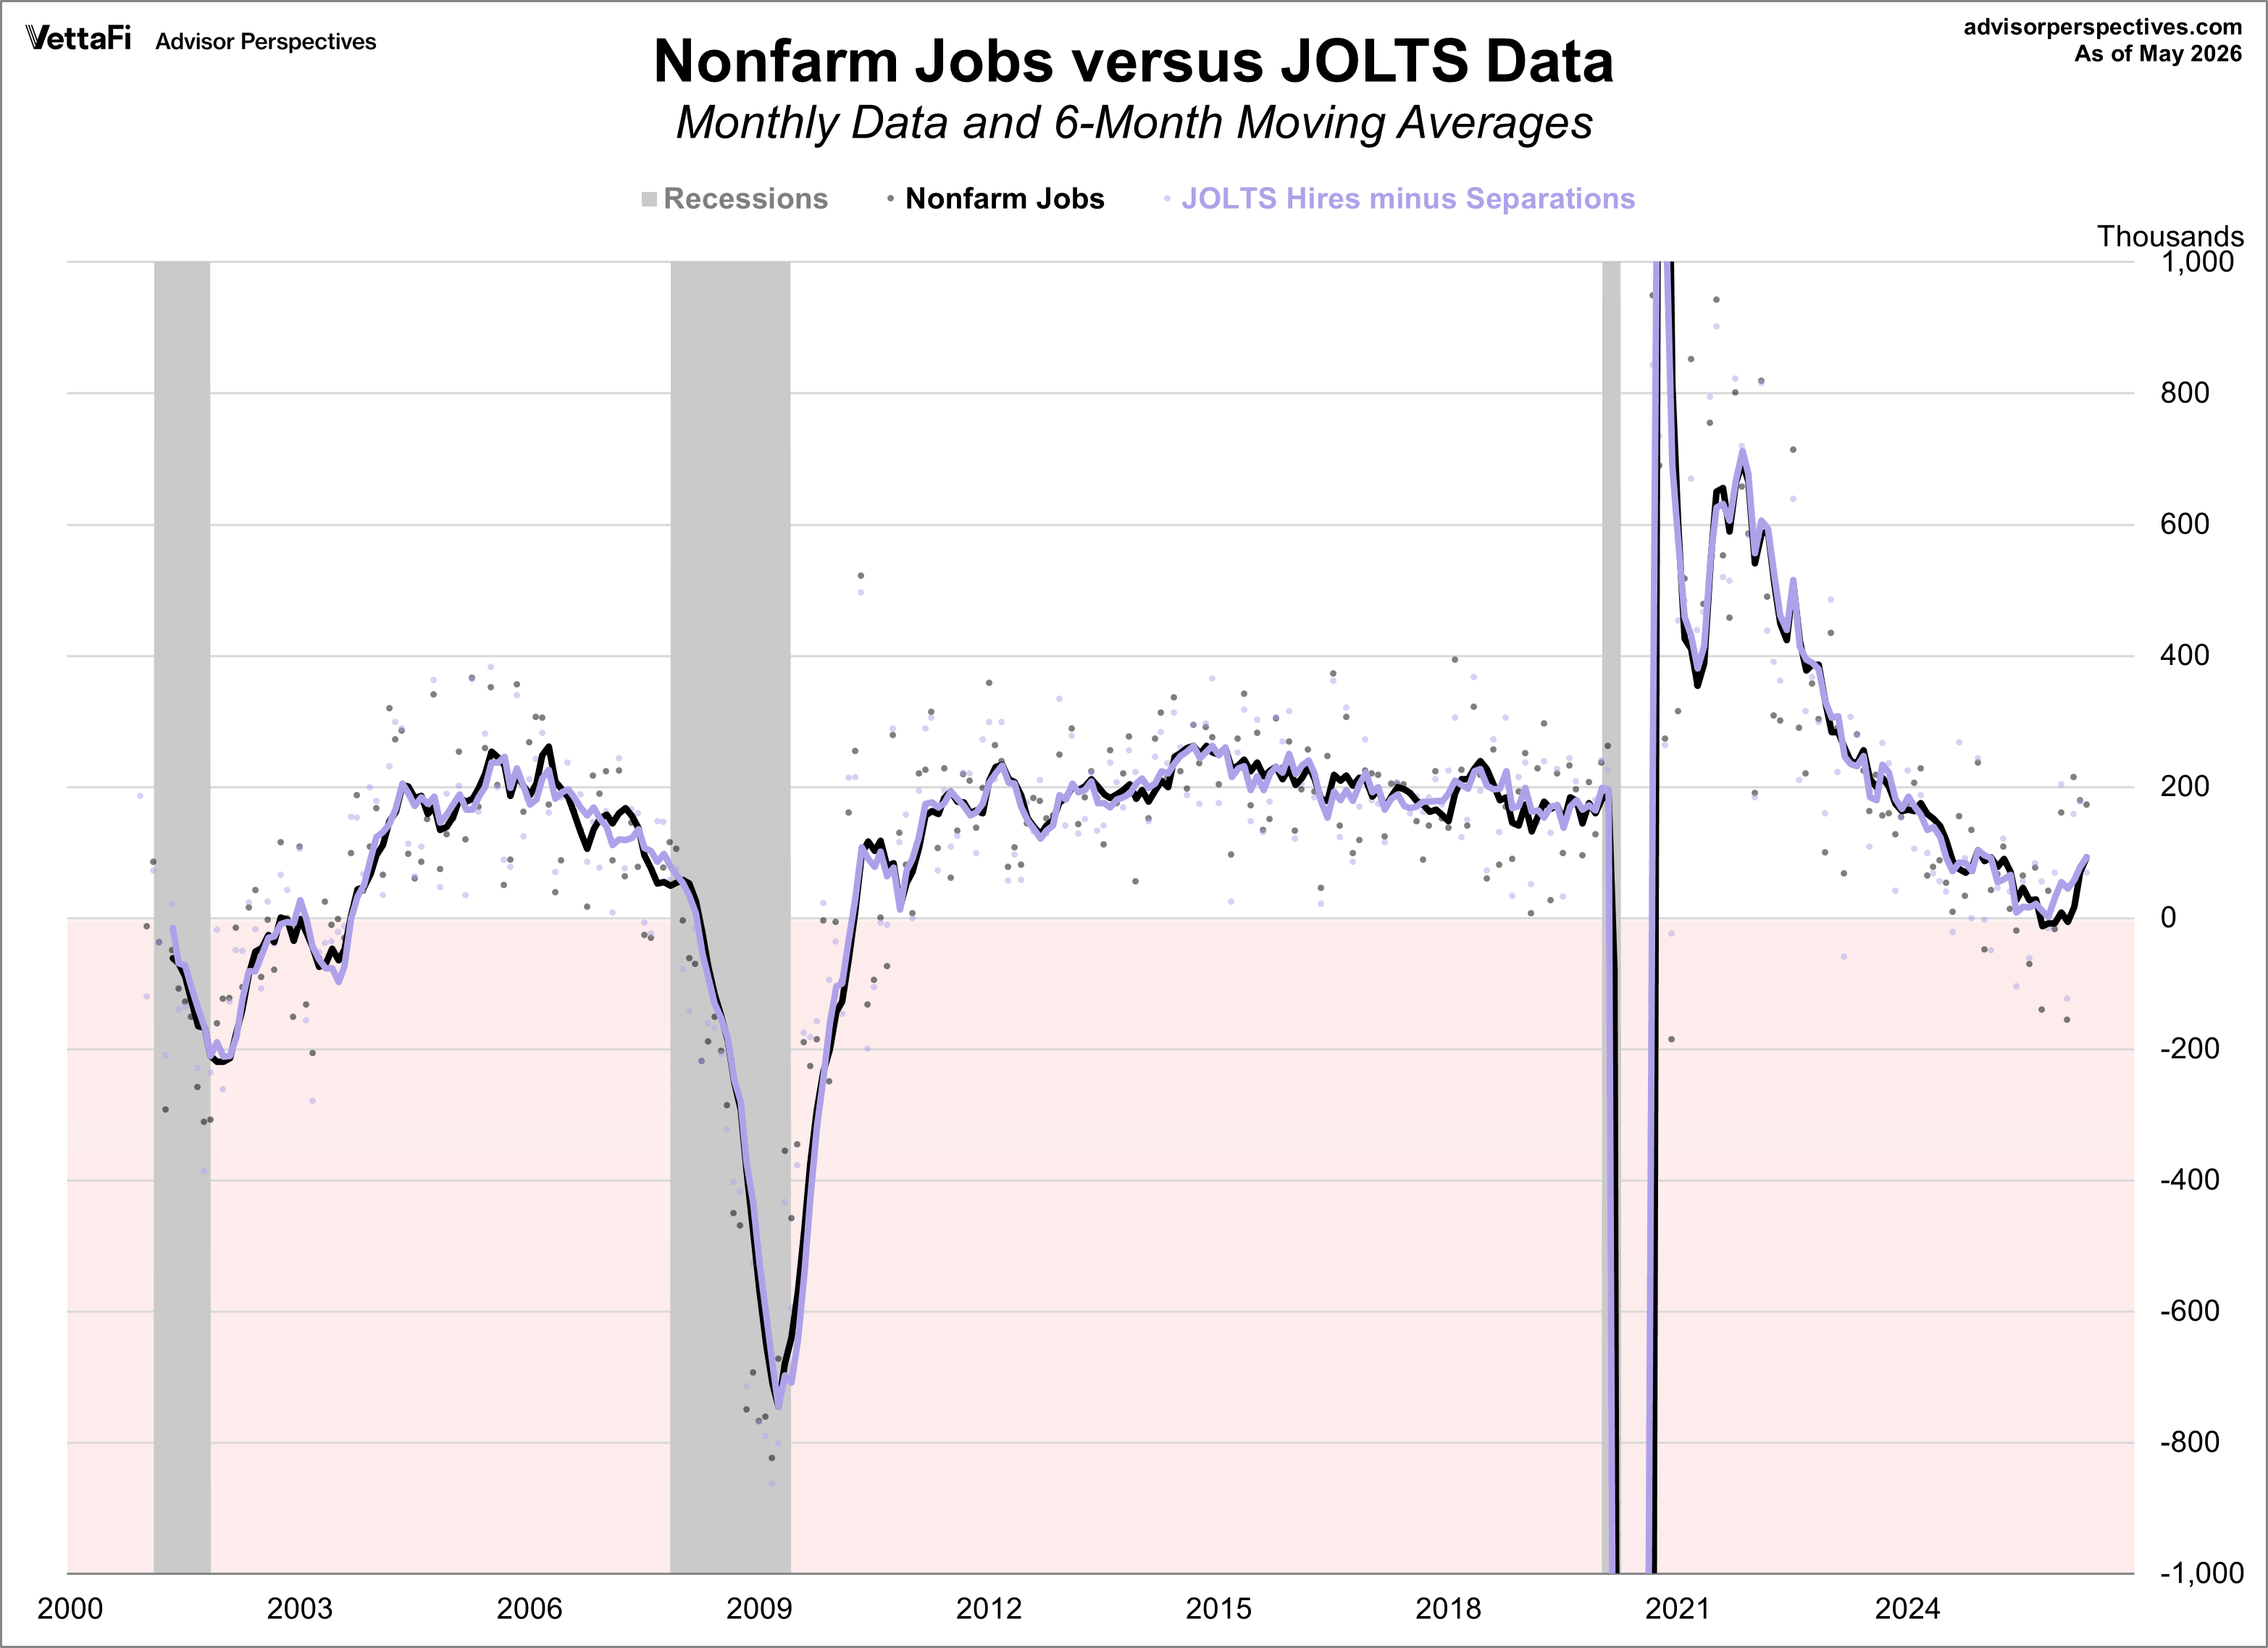
For comparison, here is the monthly BLS Employment Situation Summary charted with JOLTS data:
JOLTS: Gauging Labor Demand
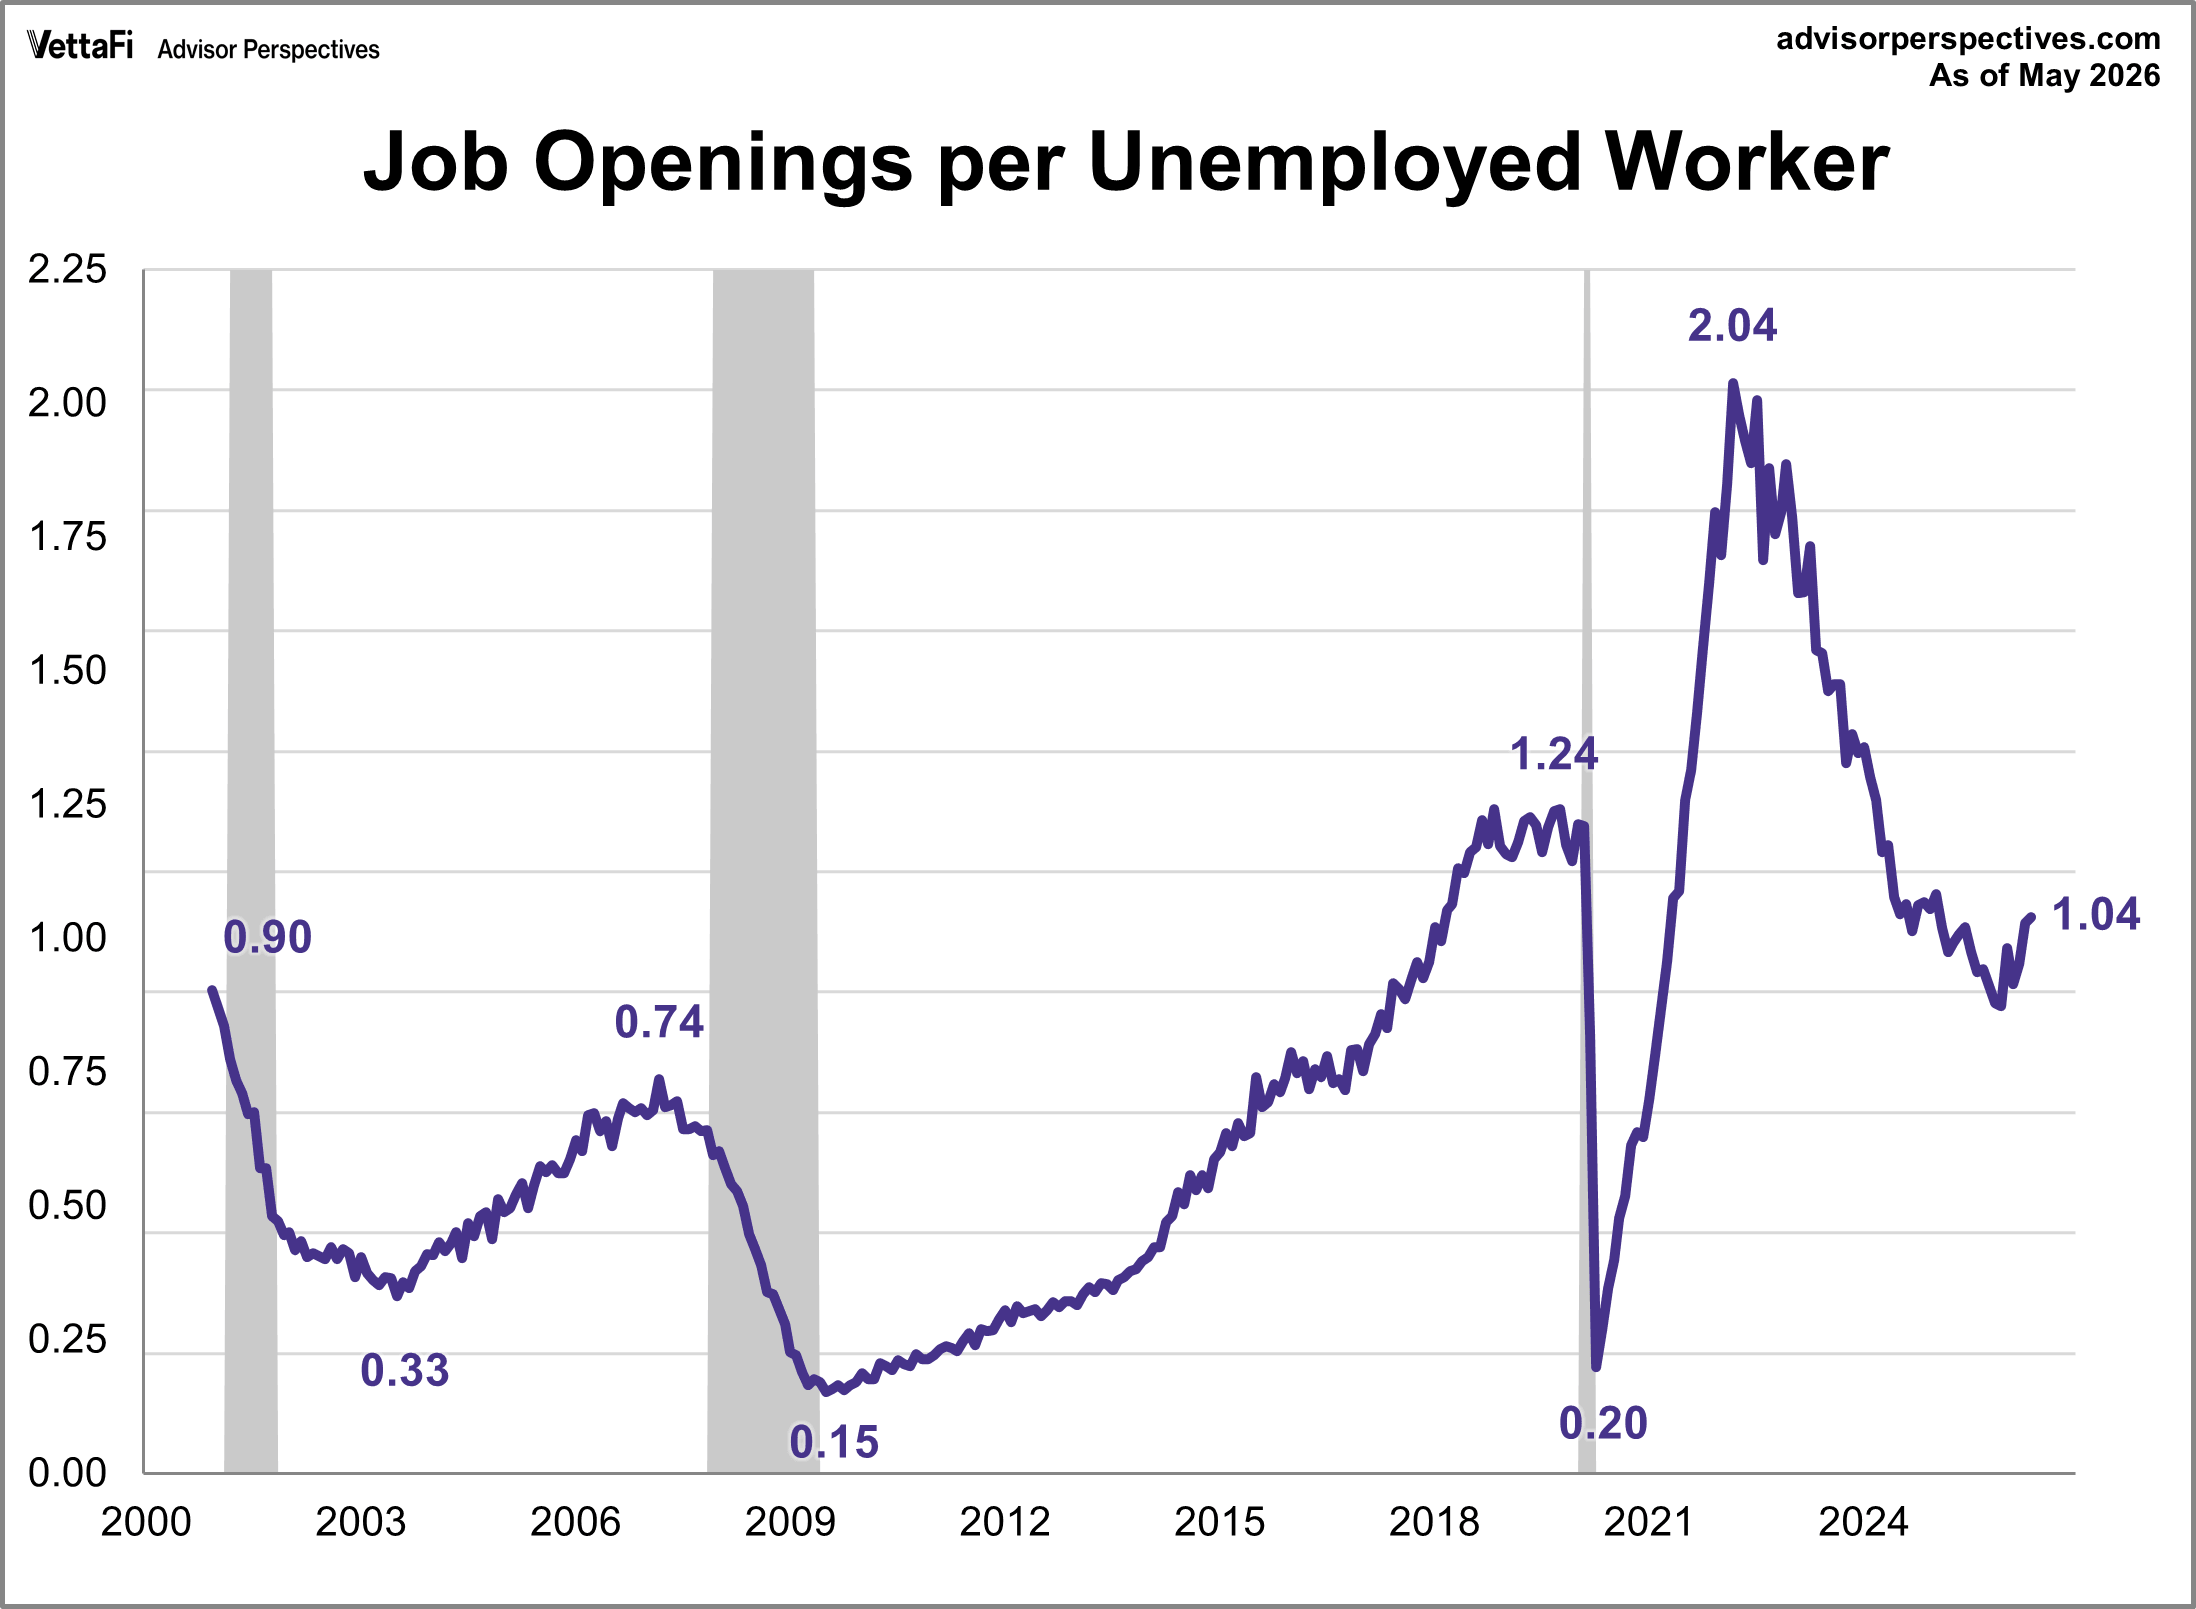
The job openings-to-workers ratio reflects labor demand by showing the balance between unfilled positions and available workers. A high ratio signals strong demand as employers struggle to hire, while a low ratio indicates weak demand due to a surplus of workers. In May, there were 7.307 million unemployed workers and 7.594 million job openings. This equates to 1.04 jobs available per unemployed worker, the highest level since January 2025 but still significantly below pre-pandemic levels.
A Population-Adjusted Perspective on JOLTS
The chart above is based on the actual numbers in the JOLTS report. A more insightful view is as a percentage of non-farm employment, providing a population-adjusted perspective. Below is the adjusted data for four JOLTS components. Each vertical axis is scaled to its high-low range to better highlight individual trends.
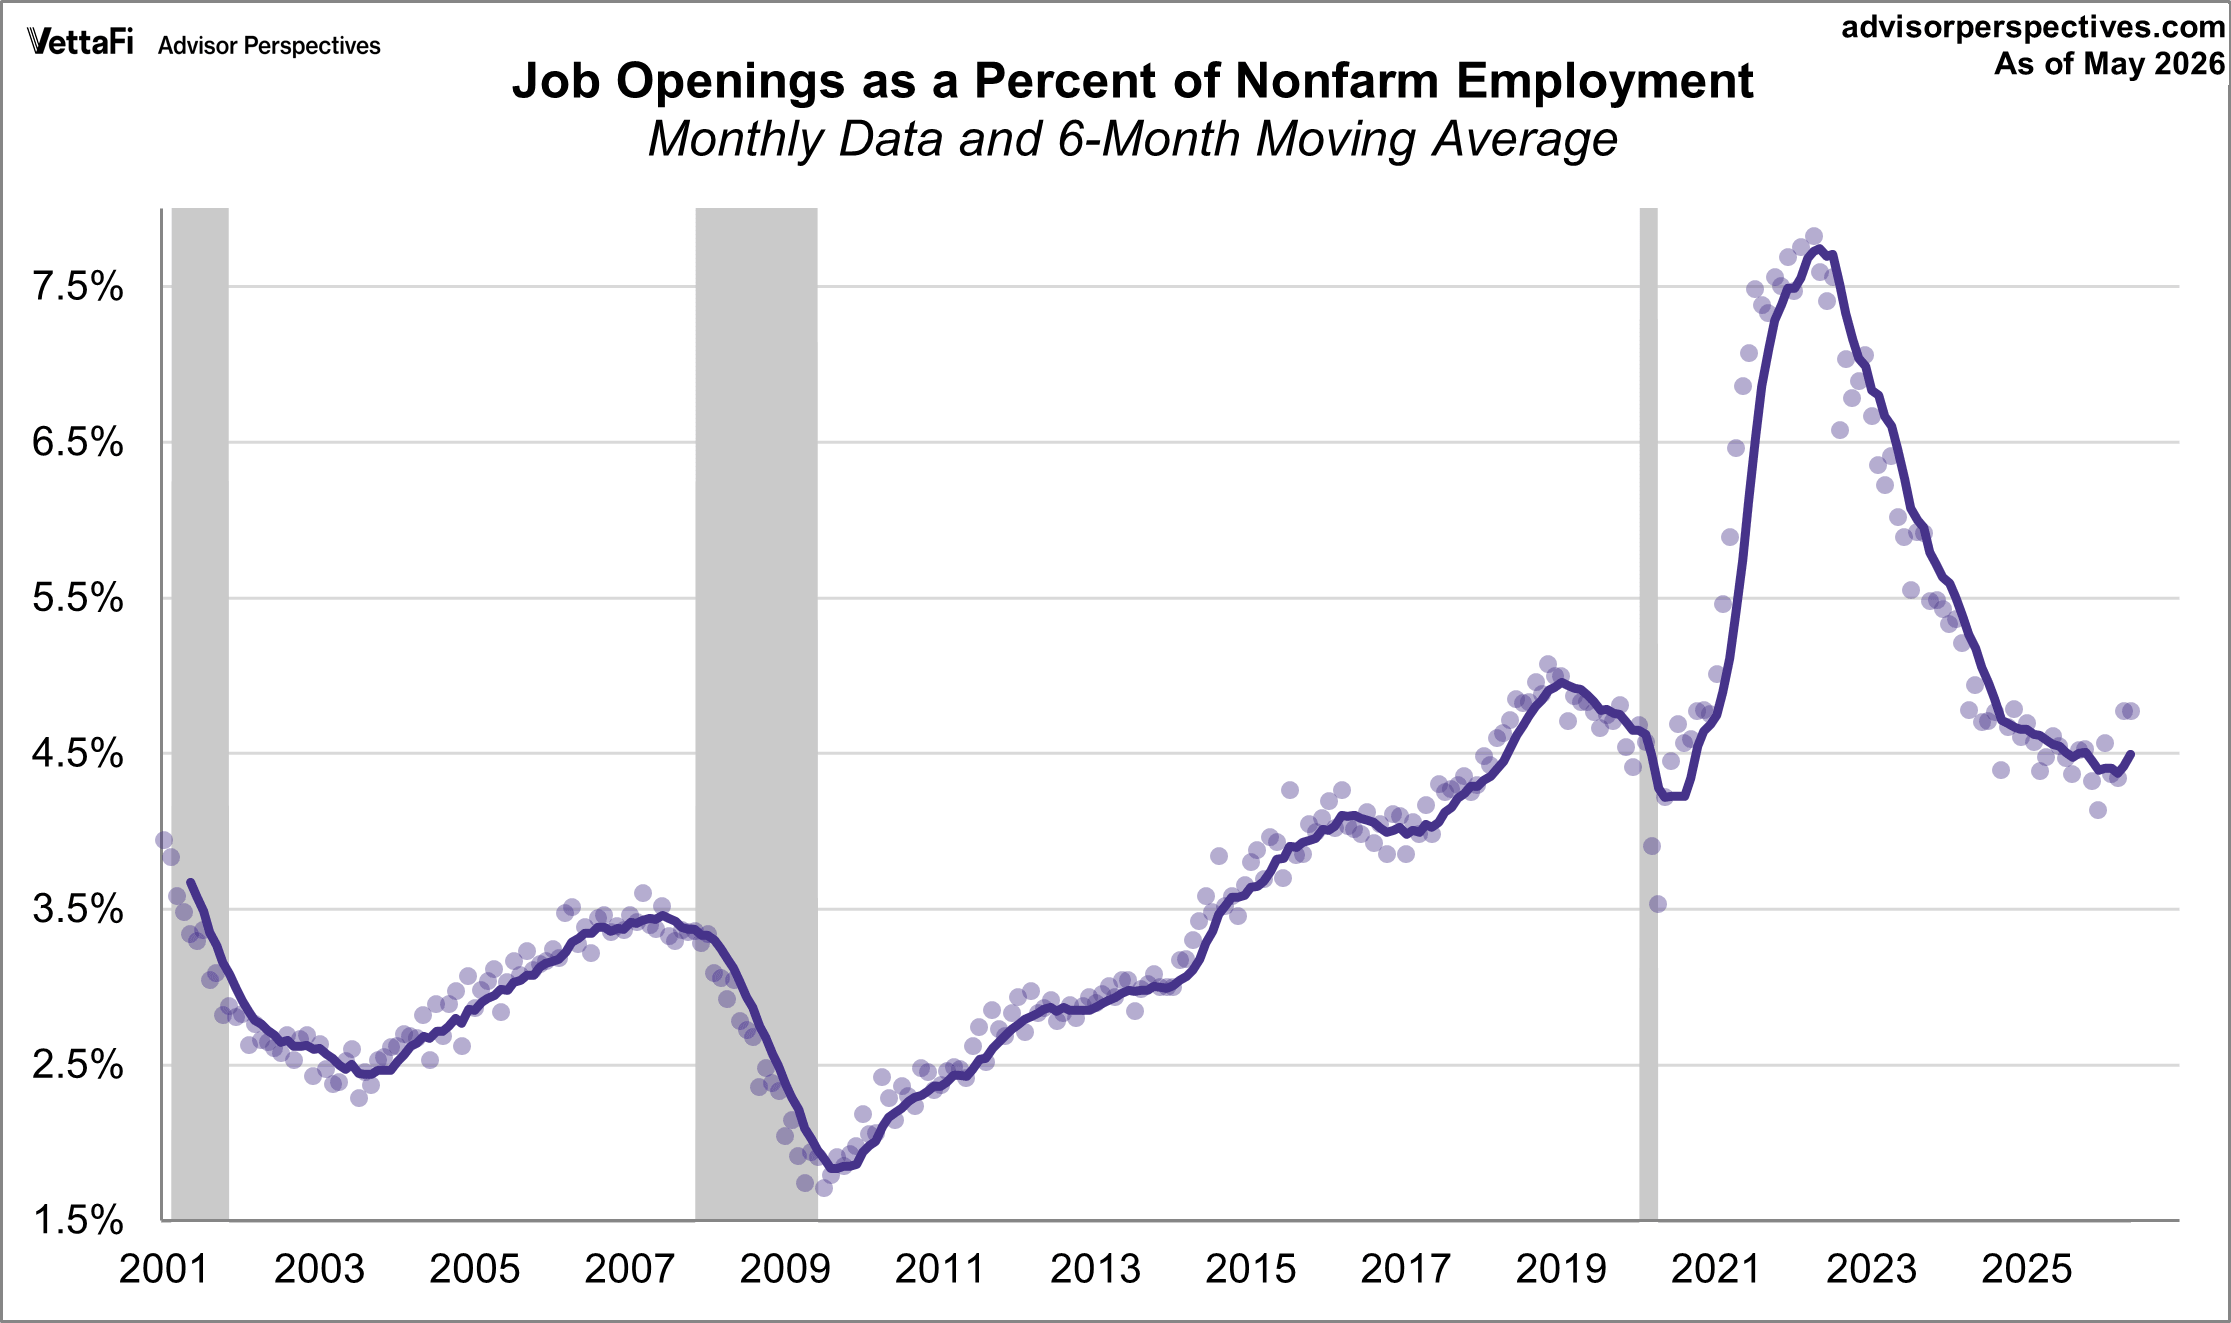
JOLTS: Job Openings
Job openings as a percent of nonfarm employment was at 4.8% in May, unchanged from the previous month.
The number and rate of job openings were unchanged at 7.6 million and 4.6 percent, respectively, in May. The number of job openings increased in wholesale trade (+71,000).
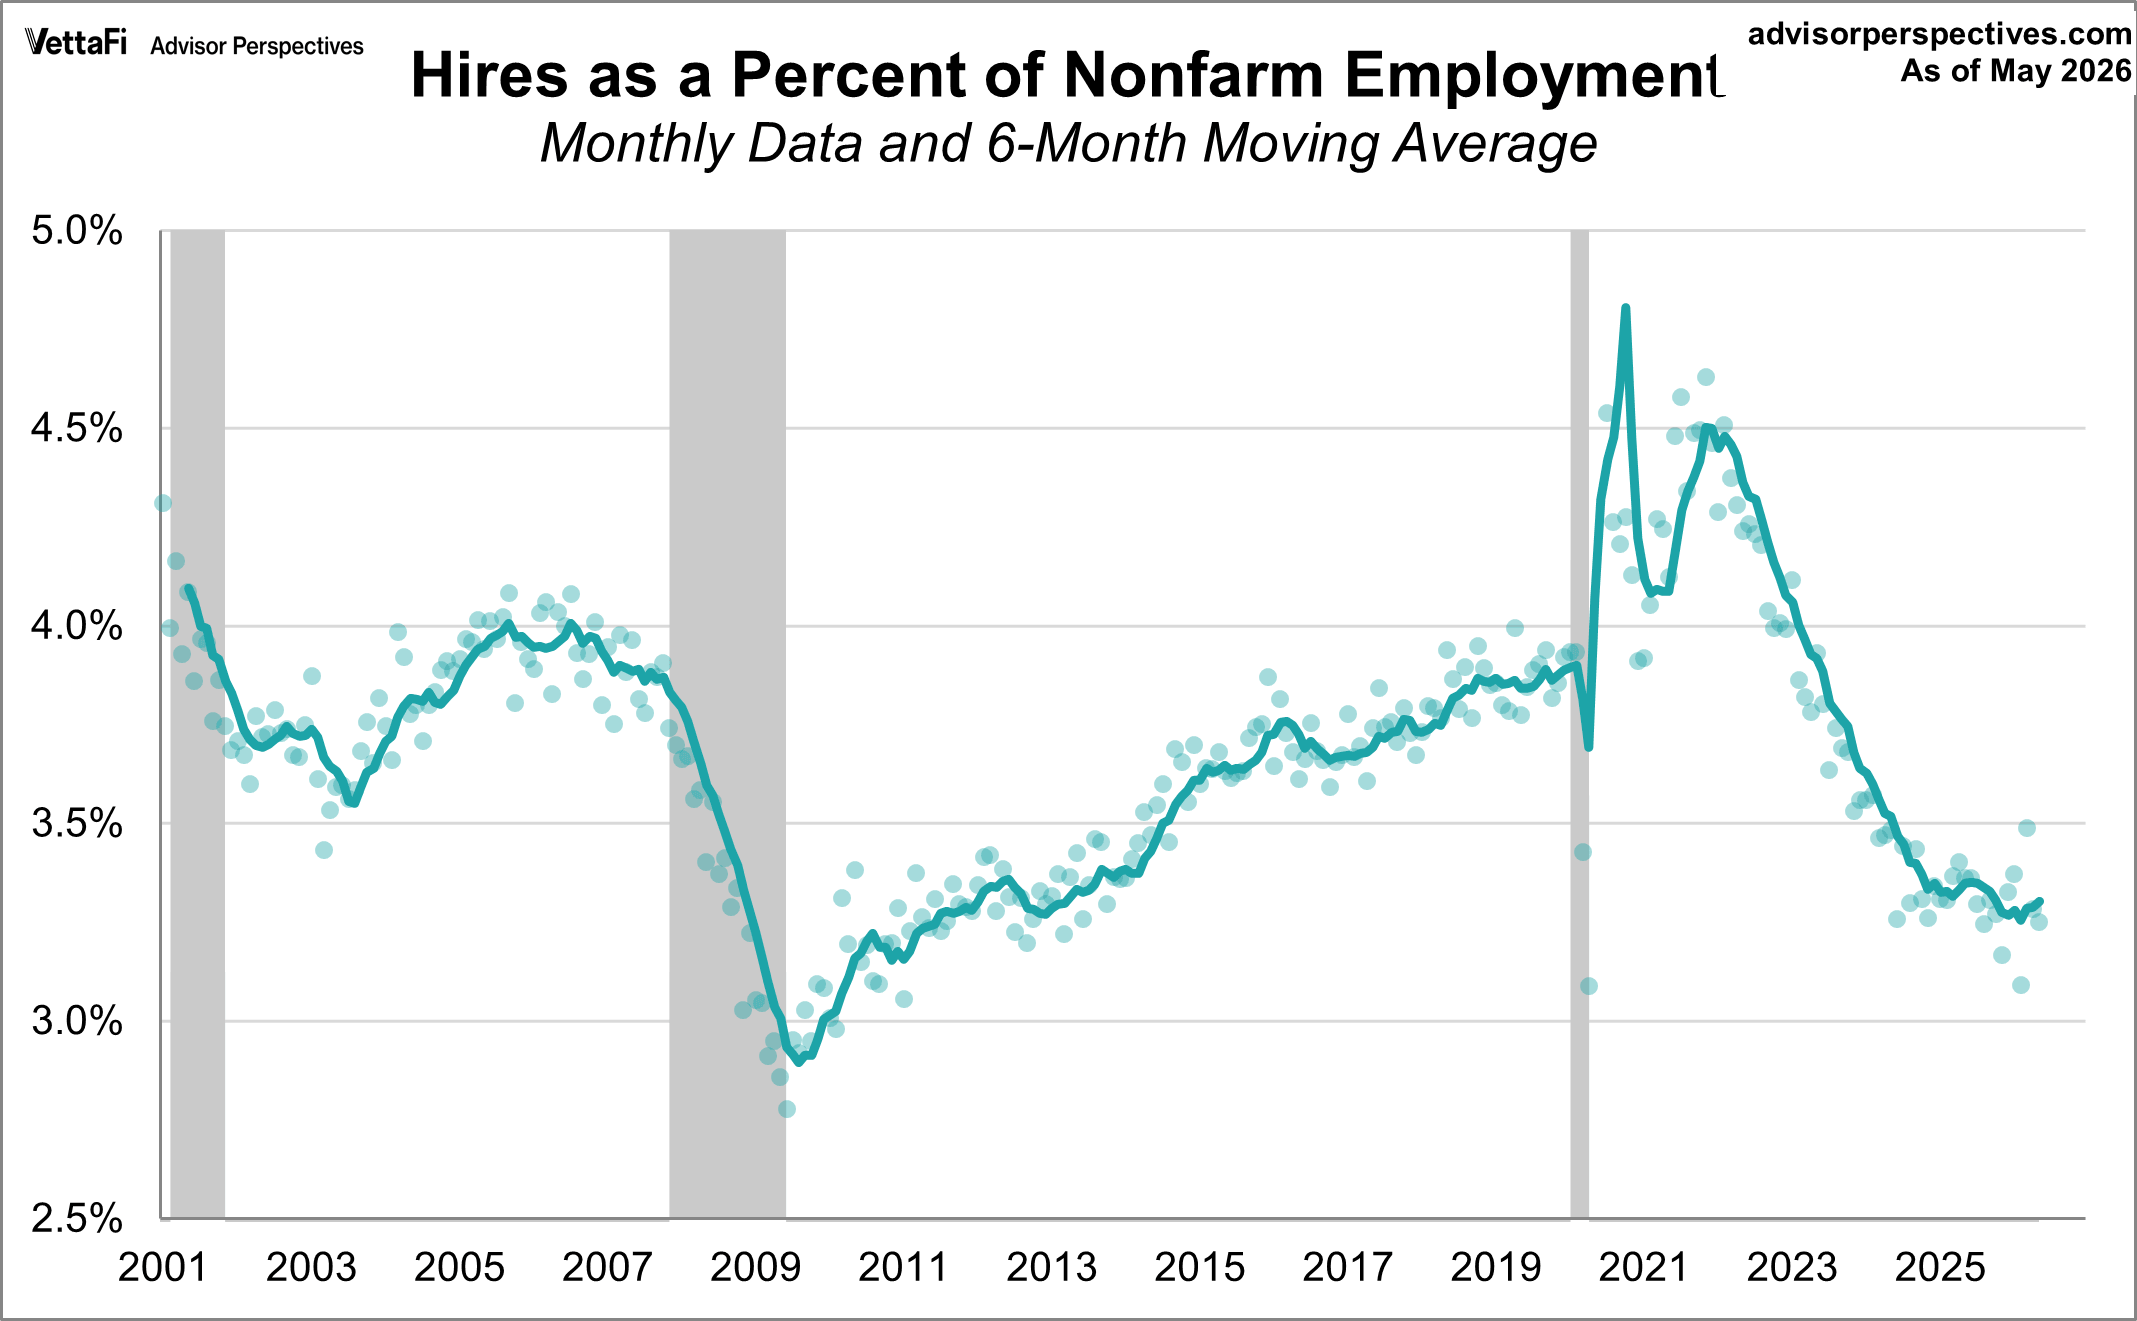
JOLTS: Hires
Hires as a percent of nonfarm employment was at 3.3% in May, unchanged from the previous month.
The number and rate of hires were unchanged at 5.2 million and 3.3 percent, respectively, in May. Hires increased in federal government (+11,000).
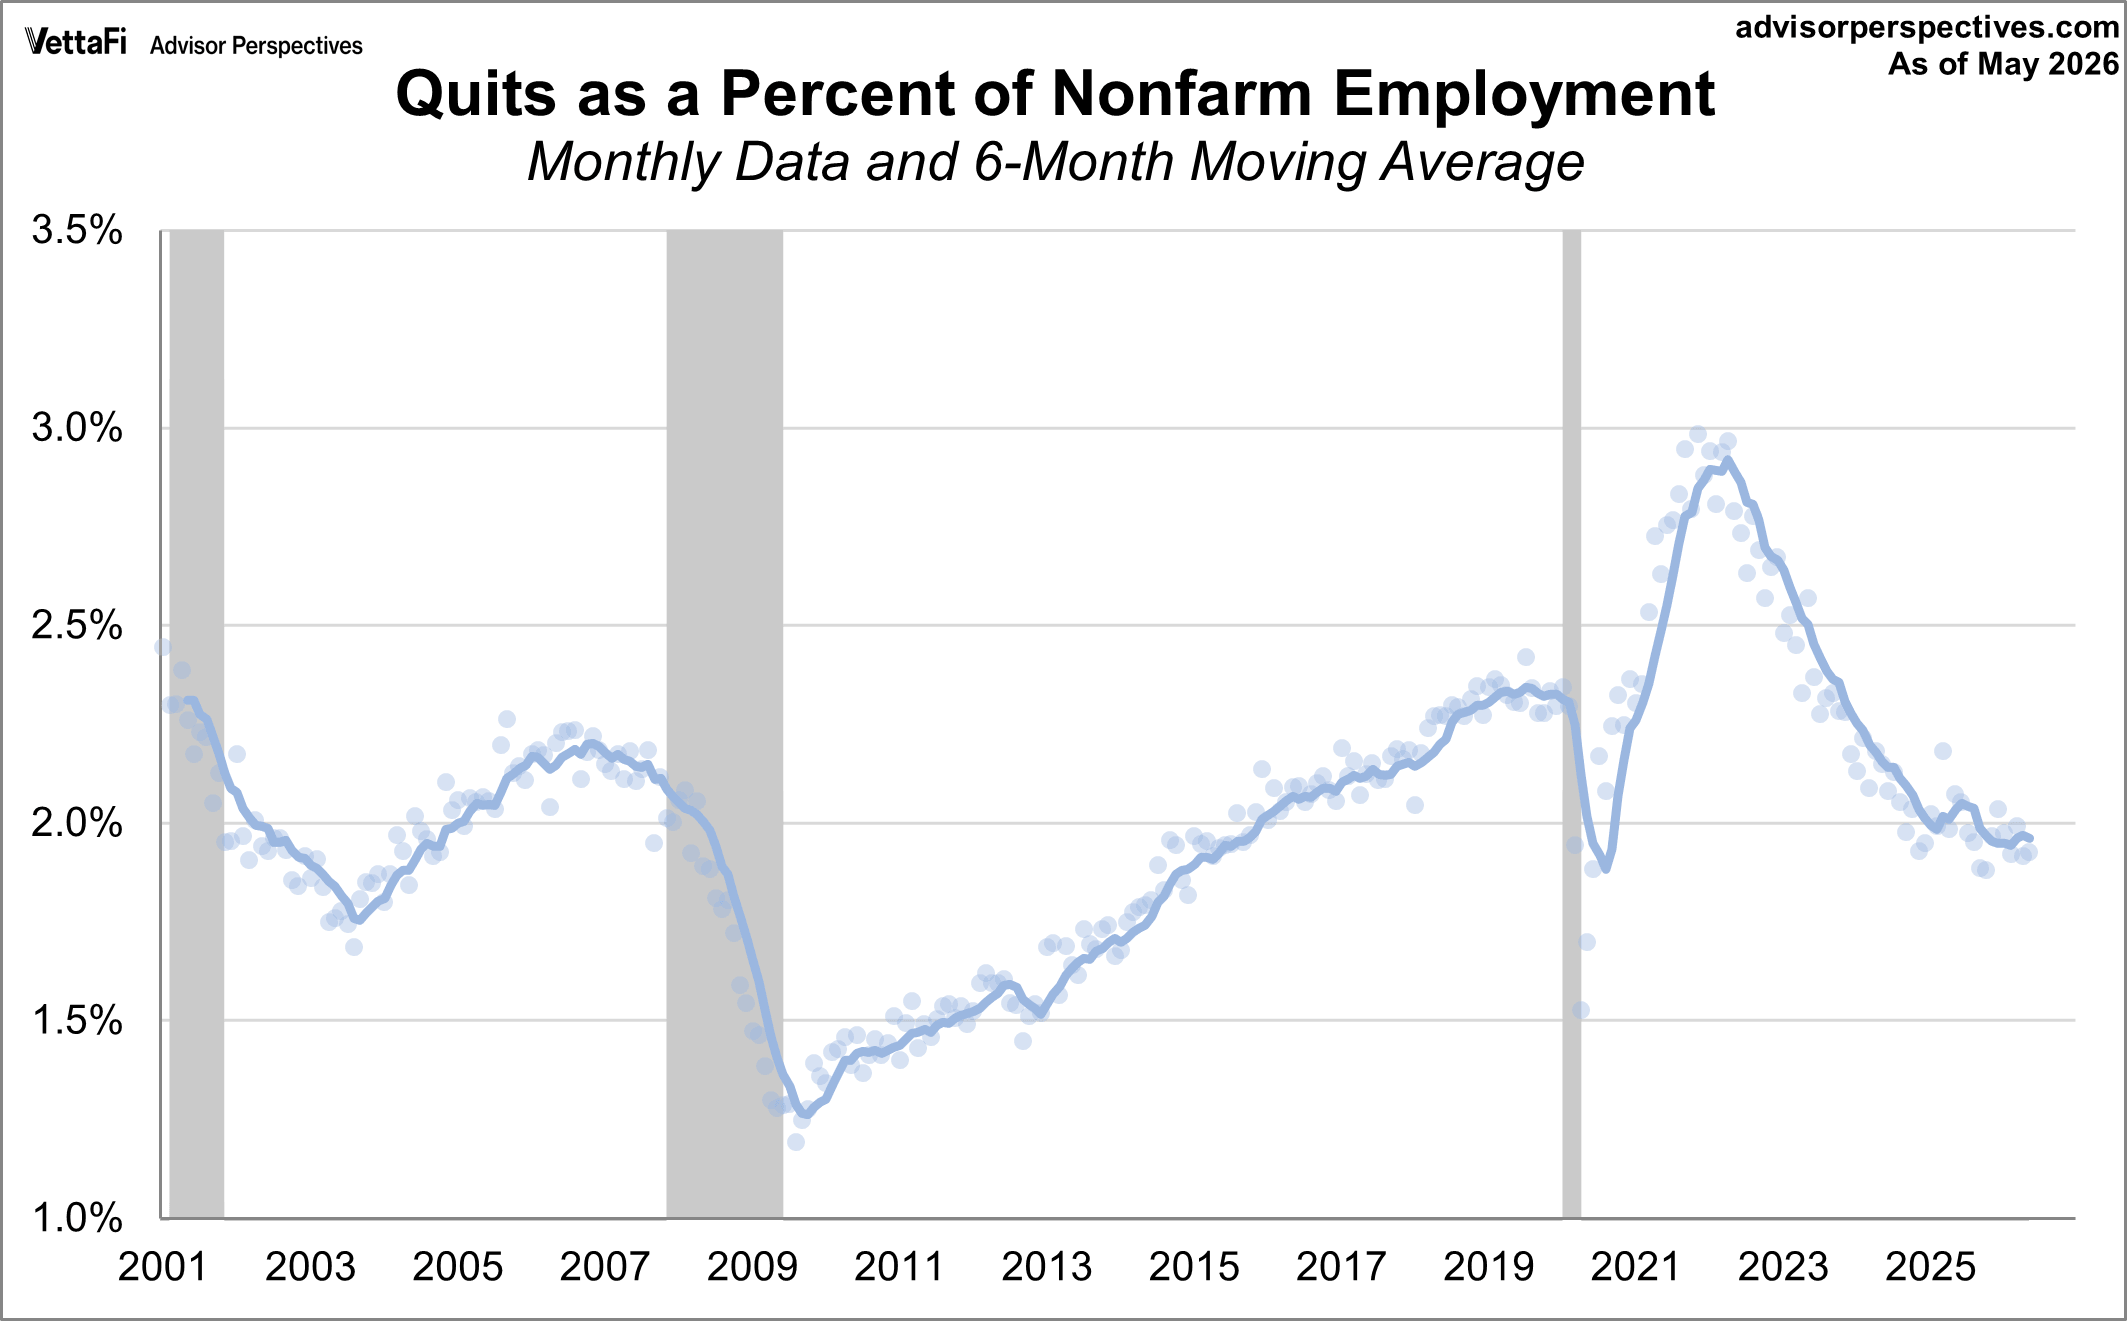
JOLTS: Quits
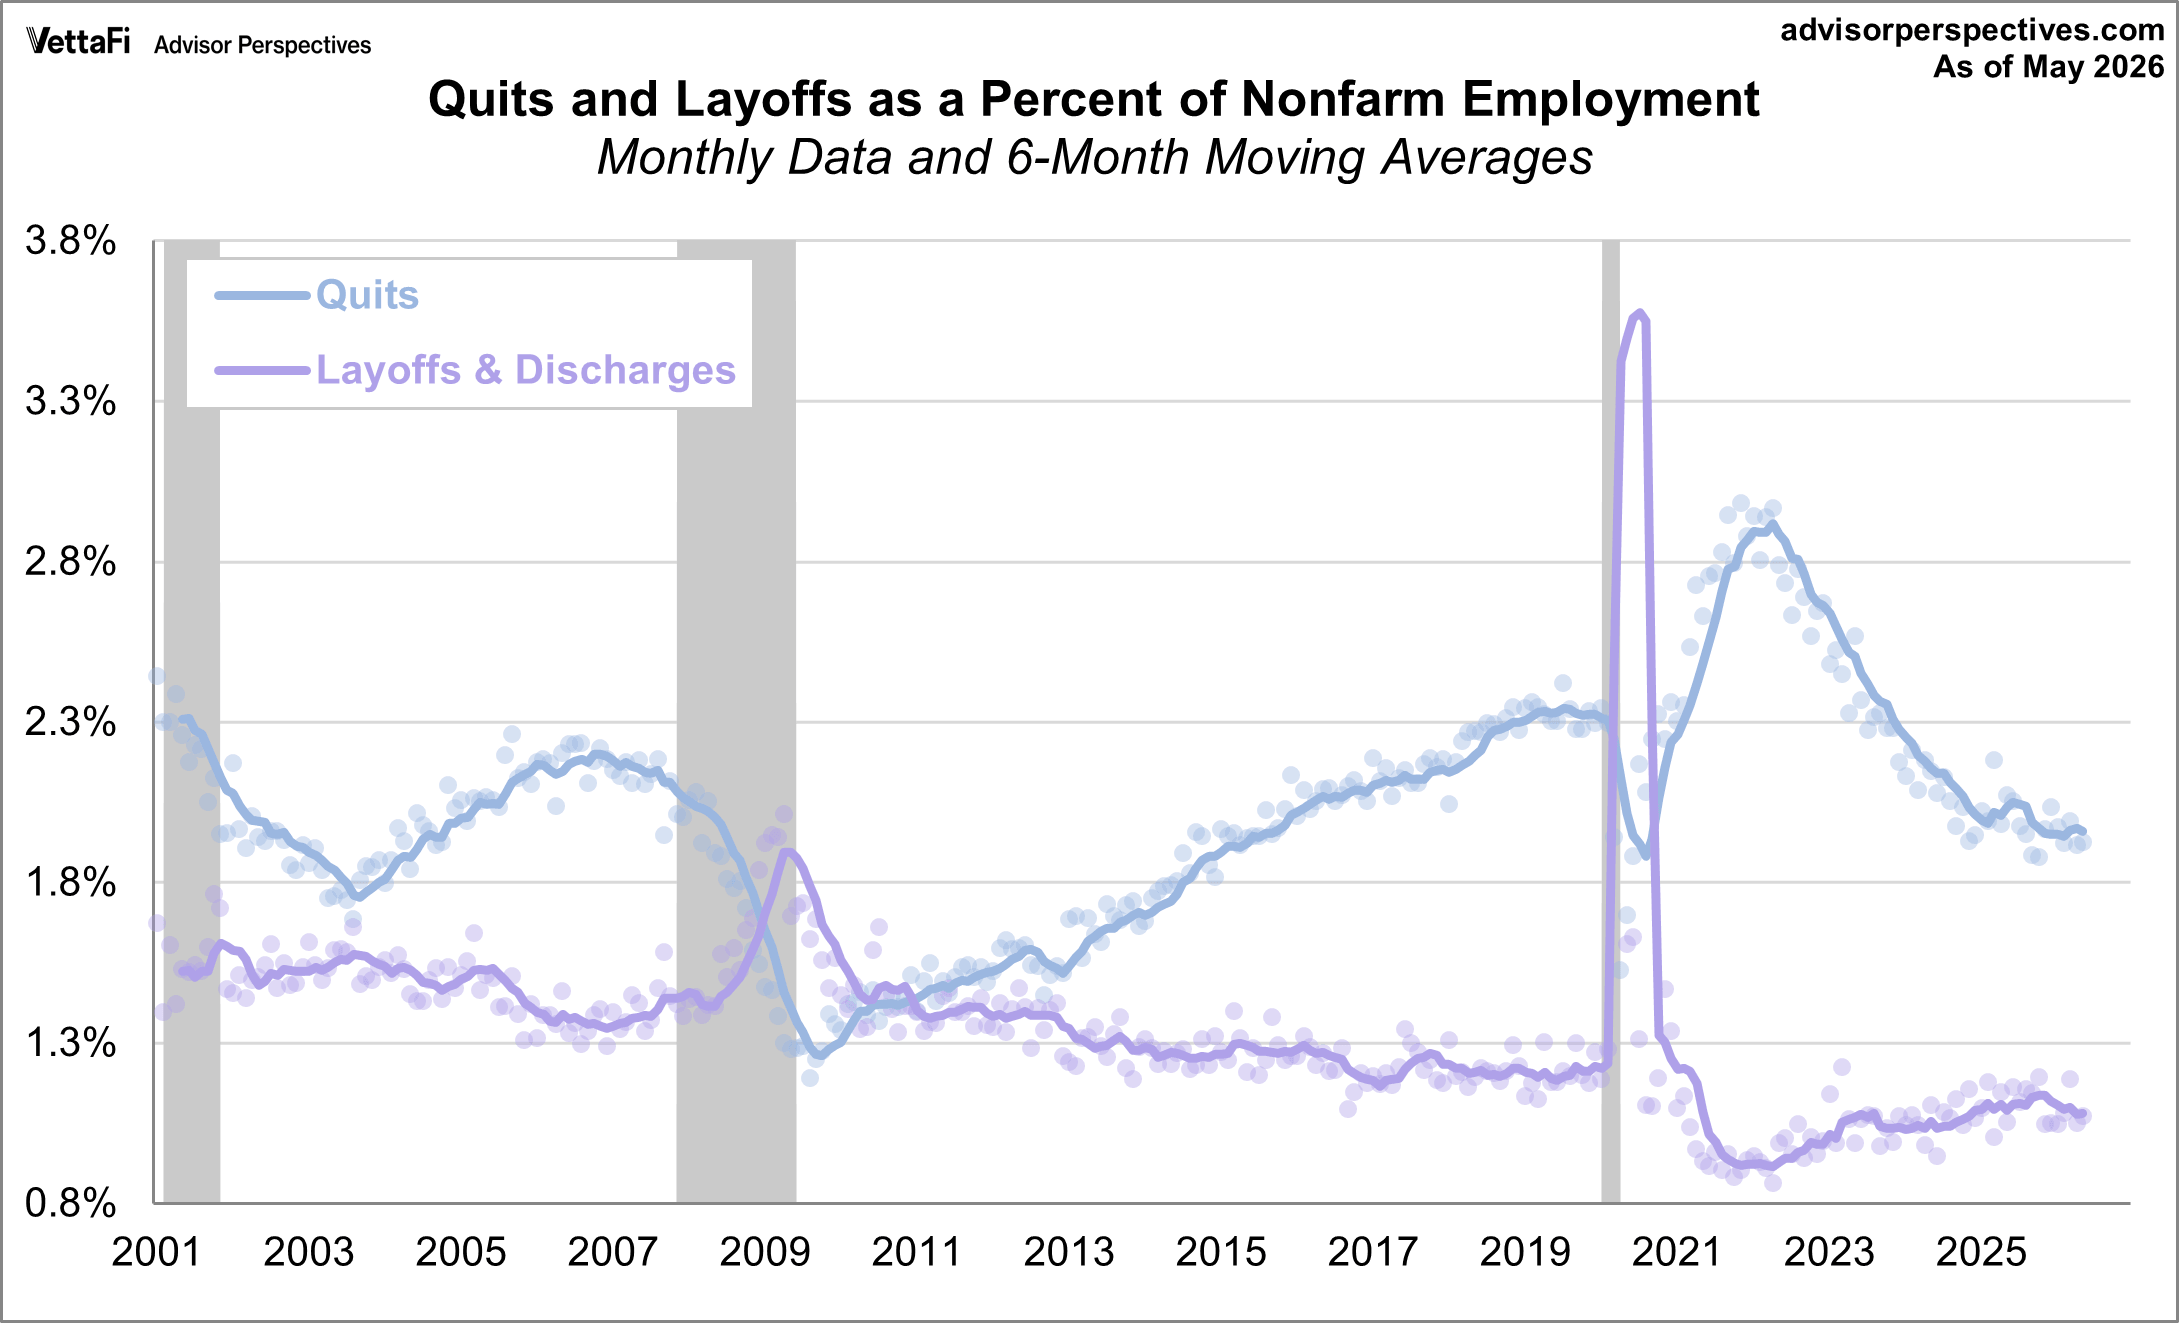
Quits as a percent of nonfarm employment was at 1.9% in May, unchanged from the previous month.
In May, the number of quits changed little at 3.1 million, while the rate was unchanged at 1.9 percent. Quits increased in federal government (+4,000).
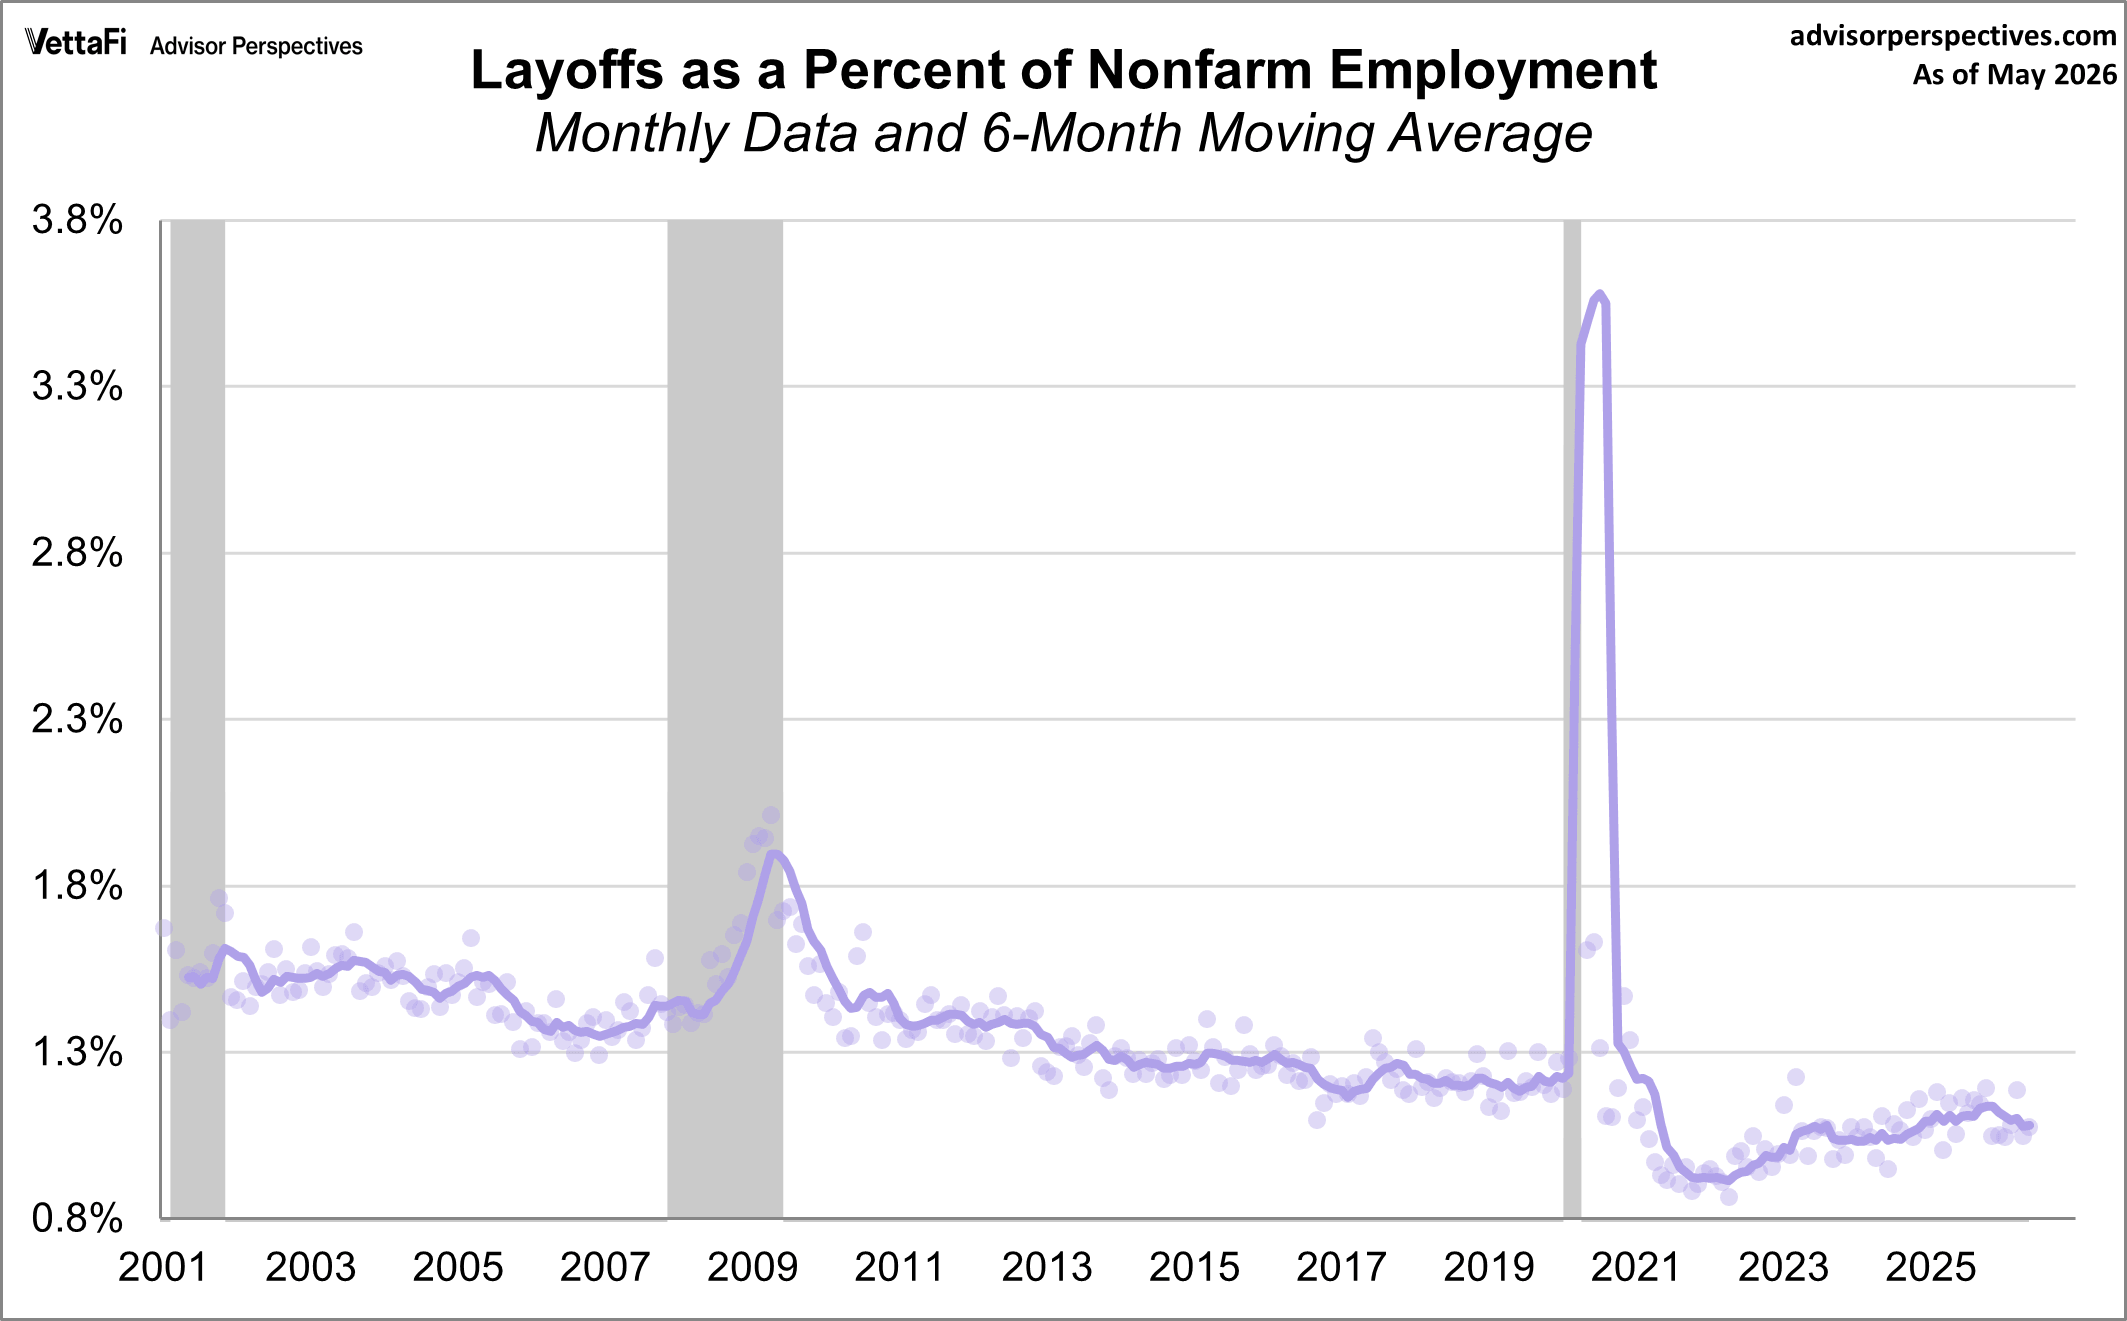
JOLTS: Layoffs
Layoffs as a percent of nonfarm employment was at 1.1% in May, up from 1.0% the previous month.
The number of layoffs and discharges was unchanged at 1.7 million, while the rate changed little at 1.1 percent in May. Layoffs and discharges decreased in arts, entertainment, and recreation (-42,000).
The Business Cycle and JOLTS
Based on the six-month moving averages, we can see that:
- The job openings moving average is above the hires levels.
- Job openings are below their all-time high, trending down, and are now near pre-pandemic levels.
- Hires are below their all-time high, trending down, and are now below pre-pandemic levels.
- Quits are below their all-time high, trending down, and are now below pre-pandemic levels.
- Layoffs and discharges continue to slowly rise but remain just below pre-pandemic levels.
The relationship between quits and layoffs
Increases in quits suggest employment flexibility and confidence among workers. Quits tend to be inversely correlated with layoffs/discharges, which are associated with economic downturns. From the Great Recession to the COVID pandemic, the quite rate steadily increased while layoffs/discharges declined and then remained stable for years. During the COVID pandemic, layoffs and discharges hit record highs while quits moved in the opposite direction. As the economy rebounded, quits reached an all-time high in March 2022 in what has been called "The Great Resignation" while layoffs/discharges dropped to record lows. Quits have since fallen below pre-pandemic levels, while layoffs and discharges are gradually rising.
It would, of course, be excellent if we had historical JOLTS data stretching back through several business cycles. However, the BLS only began tracking this data in December 2000. The time frame is quite limited compared to the main BLS data series in the monthly employment report, many of which go back to 1948, and the enormously popular non-farm employment (PAYEMS) series goes back to 1939. Nevertheless, there are some clear JOLTS correlations with the most recent business cycle trends.
The JOLTS reports is interesting to watch, but the volatility of the data, which is also subject to revisions, encourages caution in taking the data for any given month very seriously.
Here's our list of monthly employment updates:
Employment Situation Summary
ADP Employment Report
Unemployment Claims
Civilian Labor Force, Unemployment Claims, and the Business Cycle
Ratio of Part Time and Full-Time Employment
Multiple Jobholders
Read more updates by Jen Nash