Last week’s data tracked a shifting economic trajectory over the last several months. While the latest reading on first-quarter GDP confirms the economy started the year with steady growth, subsequent inflation metrics moved higher and ultimately weighed on consumer confidence.
Valid until the market close on June 30, 2026
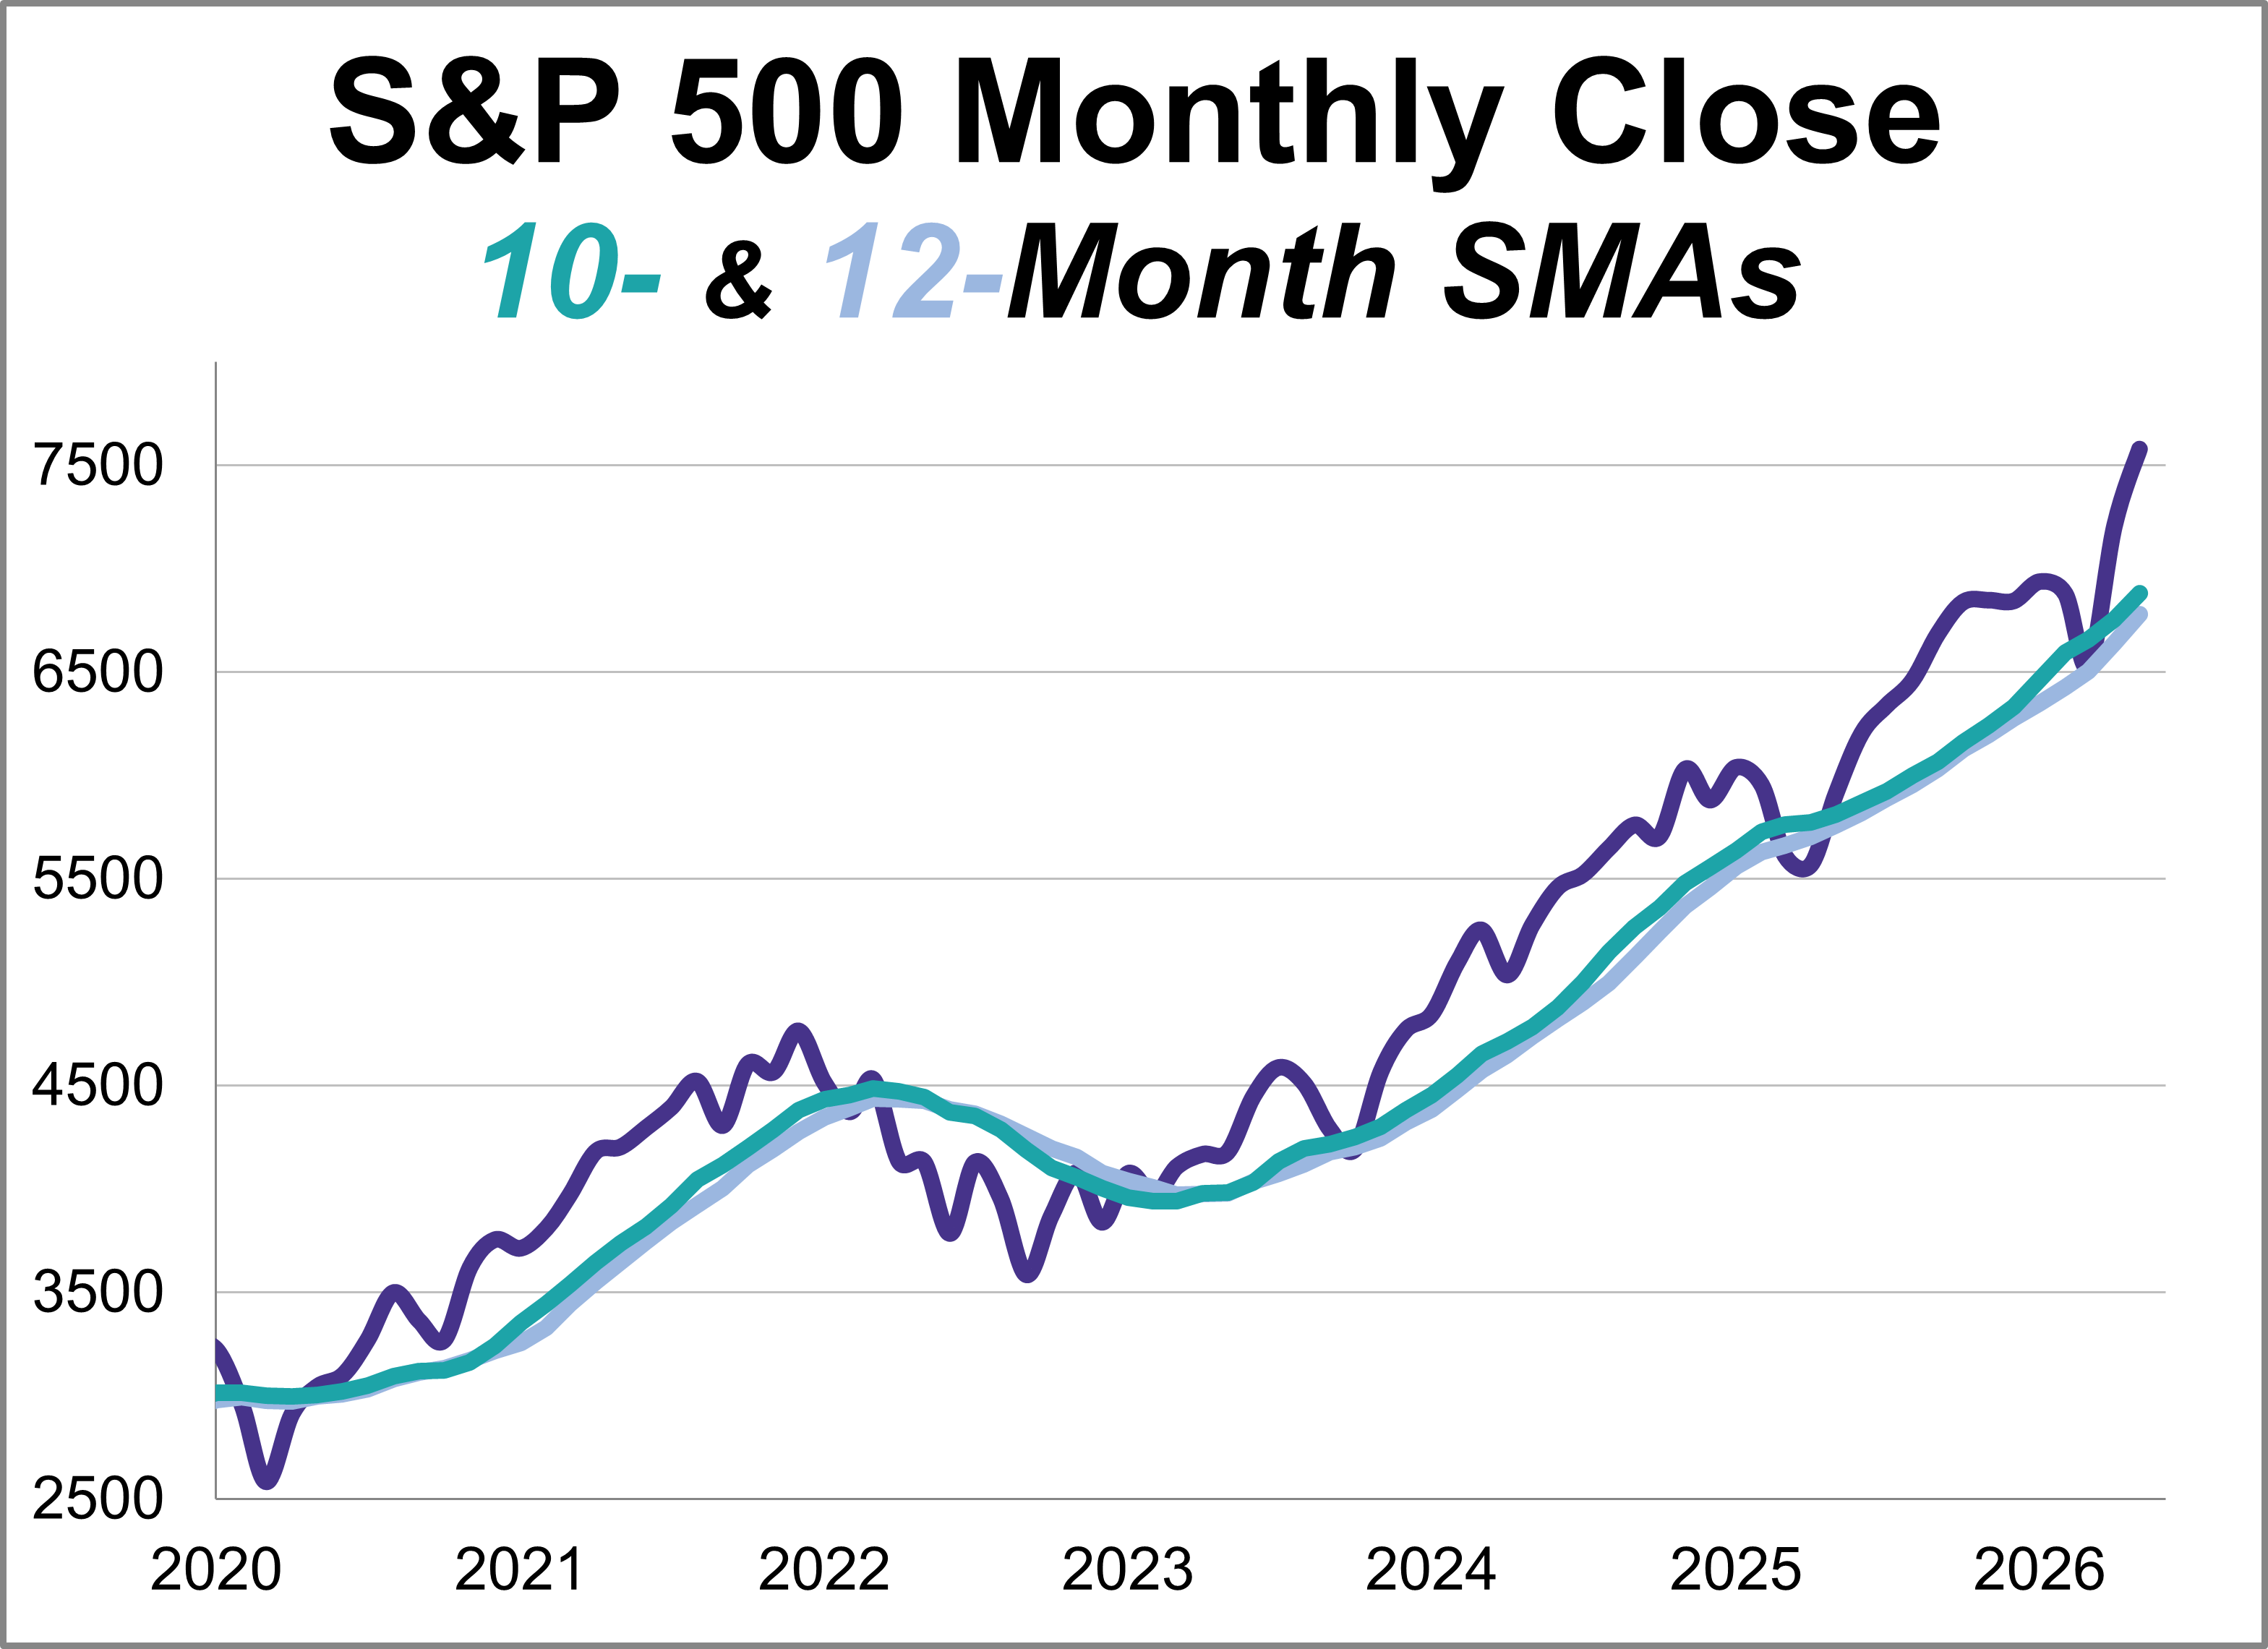
This article provides an update on the monthly moving averages we track for the S&P 500 and the Ivy Portfolio after the close of the last business day of the month.
Building on the last week's strength, the S&P 500 rose every day this week and set multiple new record highs. With a 1.6% weekly increase, the index secured its ninth straight weekly gain, matching its longest winning streak from 2023.
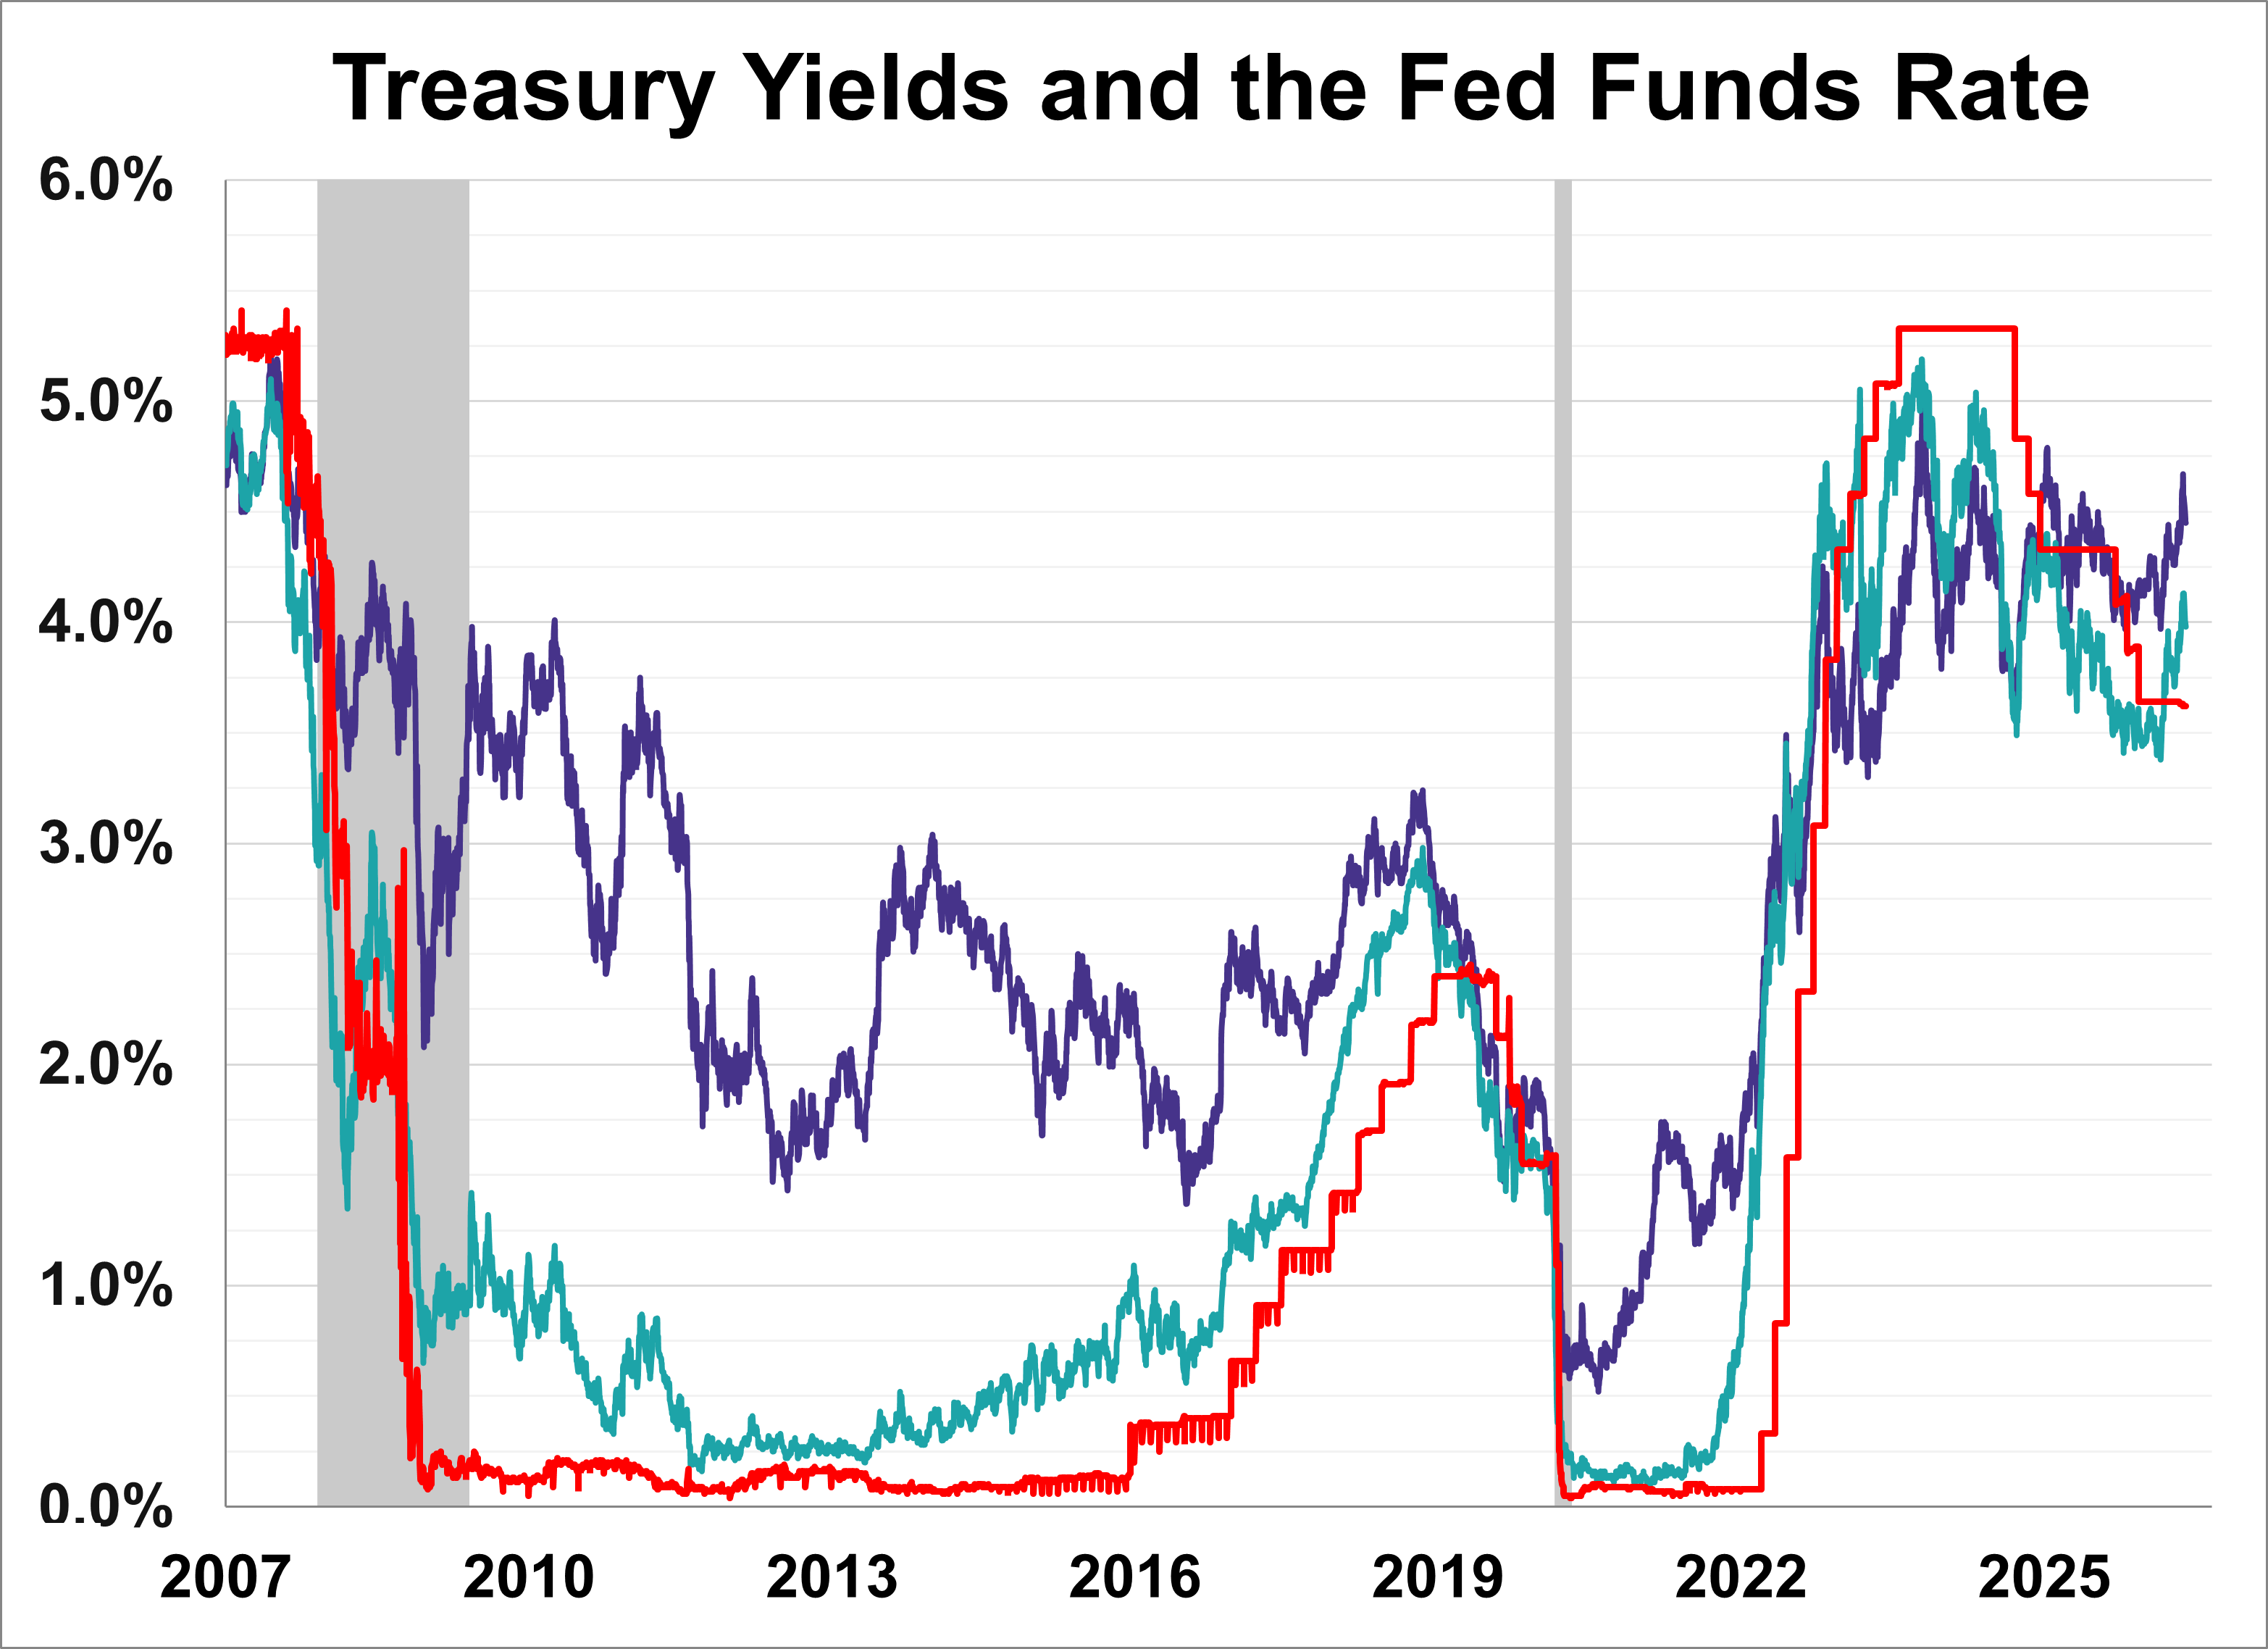
The yield on the 10-year note finished May 29, 2026 at 4.45% while the 2-year note ended at 3.98%.
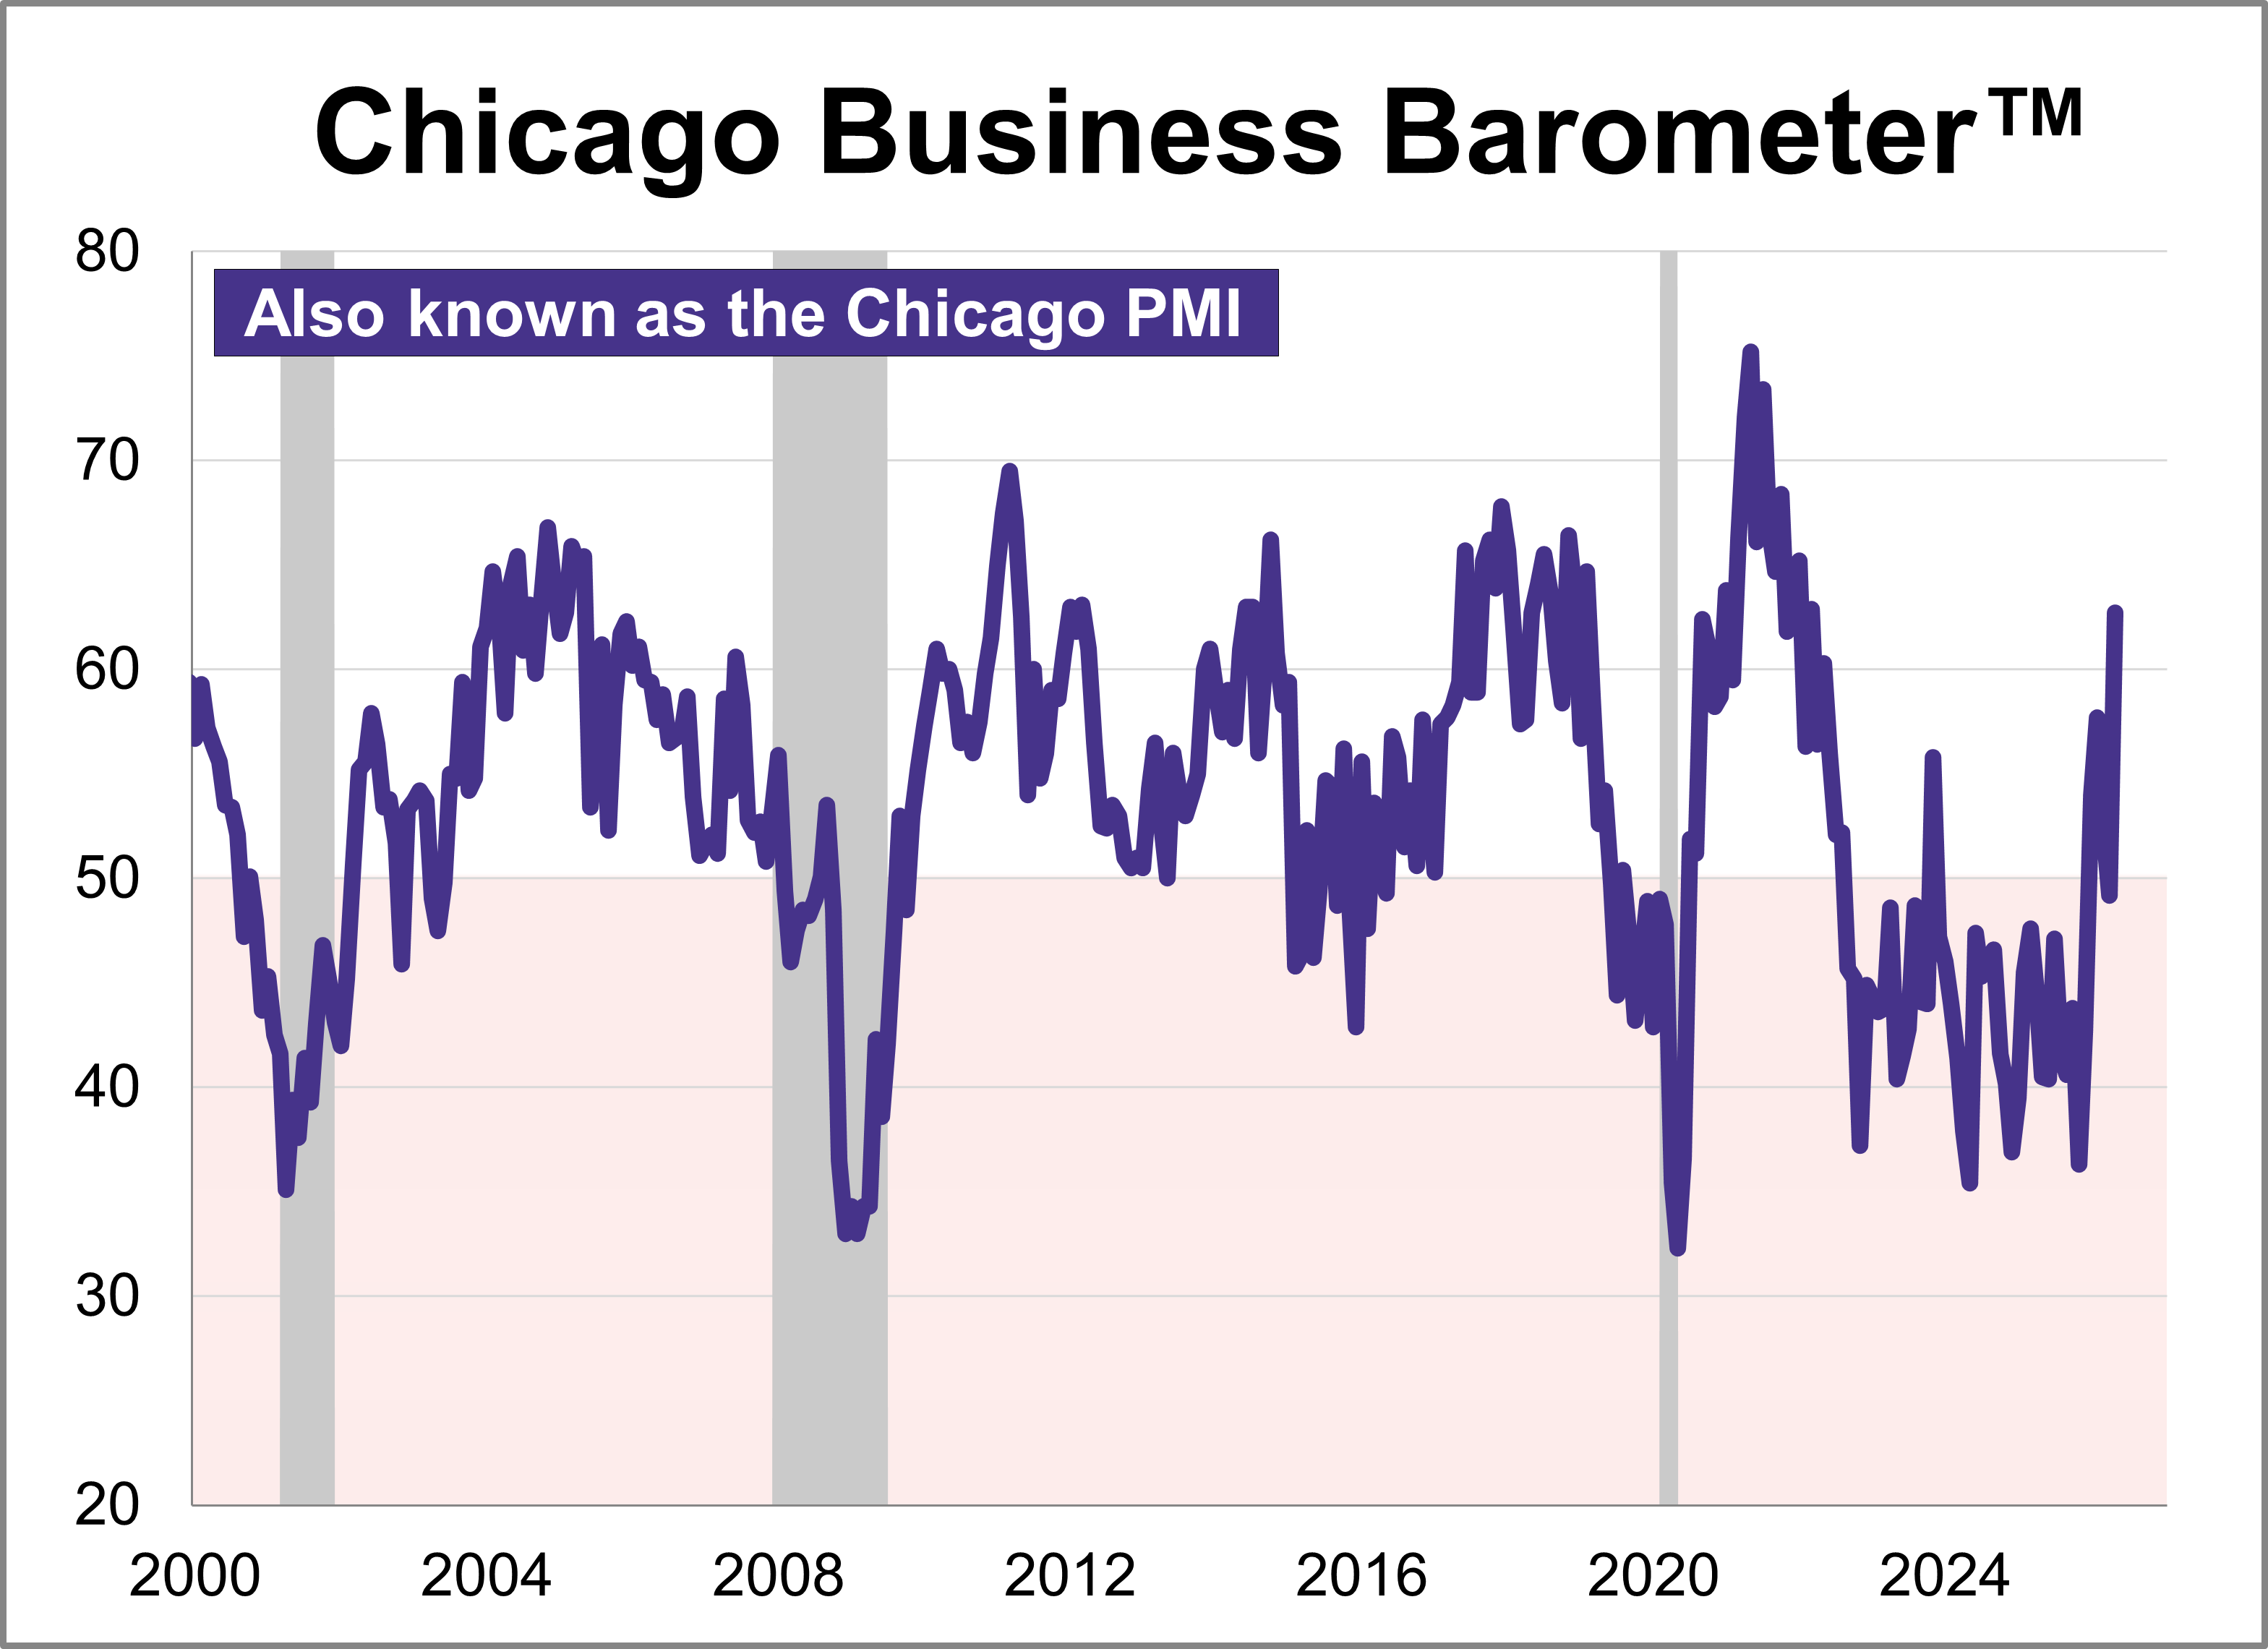
The Chicago Purchasing Managers’ Index surged 13.5 points in May to a four-year high of 62.7, signaling an expansion in regional business activity. This marks the largest monthly increase since 2020 and was significantly higher than the projected 50.6.
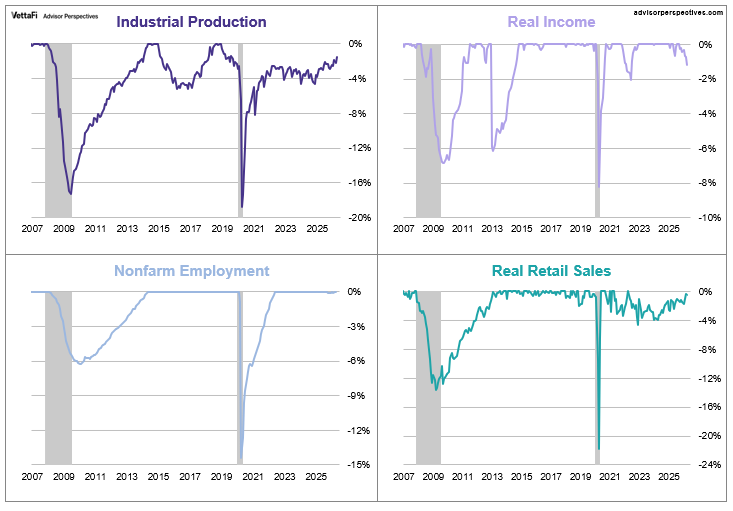
Official recession calls are the responsibility of the NBER Business Cycle Dating Committee, which is understandably vague about the specific indicators on which they base their decisions. There is, however, a general belief that there are four big indicators that the committee weighs heavily in their cycle identification process.
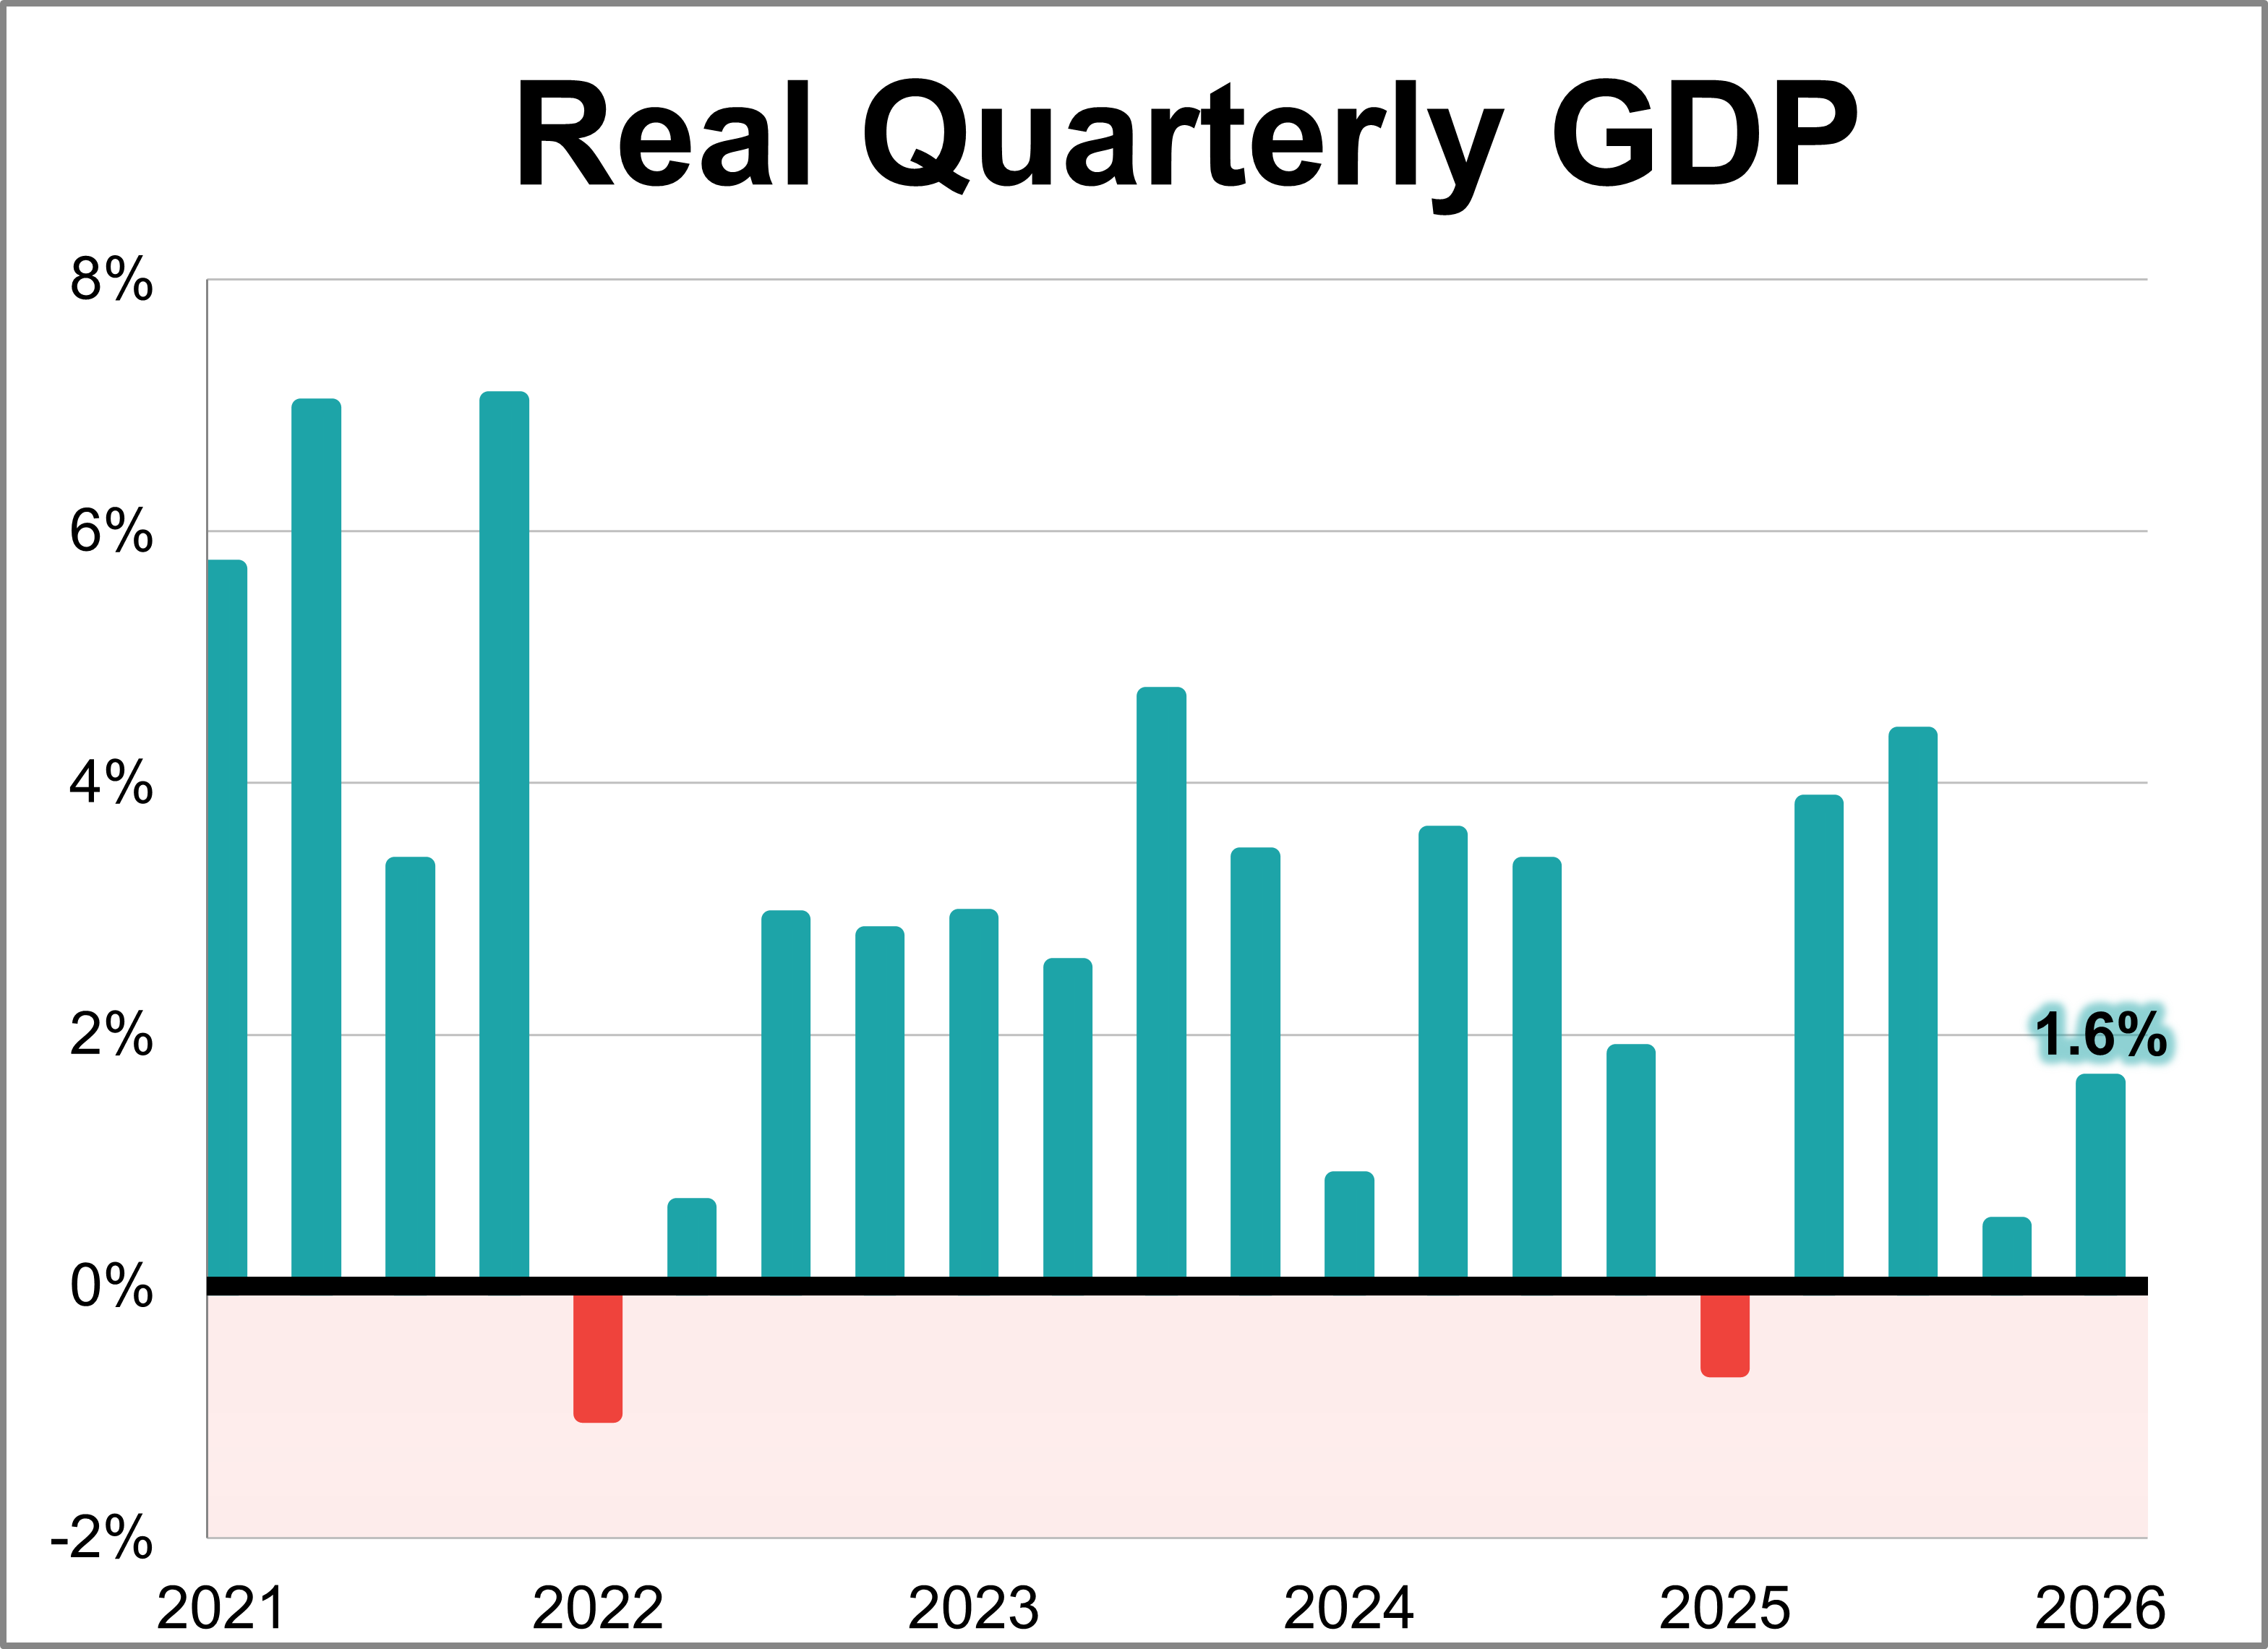
The second estimate for Q1 GDP came in at 1.62%, an acceleration from 0.48% for the Q4 final estimate. With a per-capita adjustment, the headline number is lower at 1.44%, a pickup from 0.18% for the Q4 headline number.
Real gross domestic product (GDP) is comprised of four major subcomponents. In the Q1 2026 GDP second estimate, three of the four components made positive contributions.
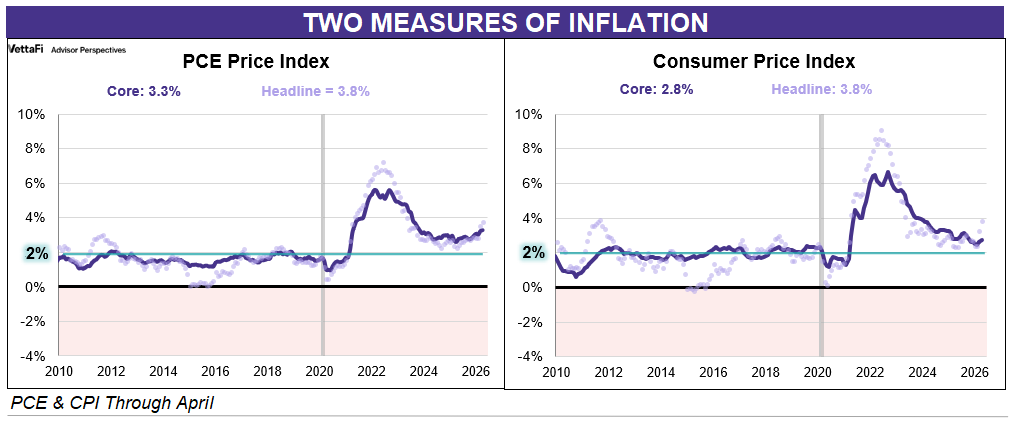
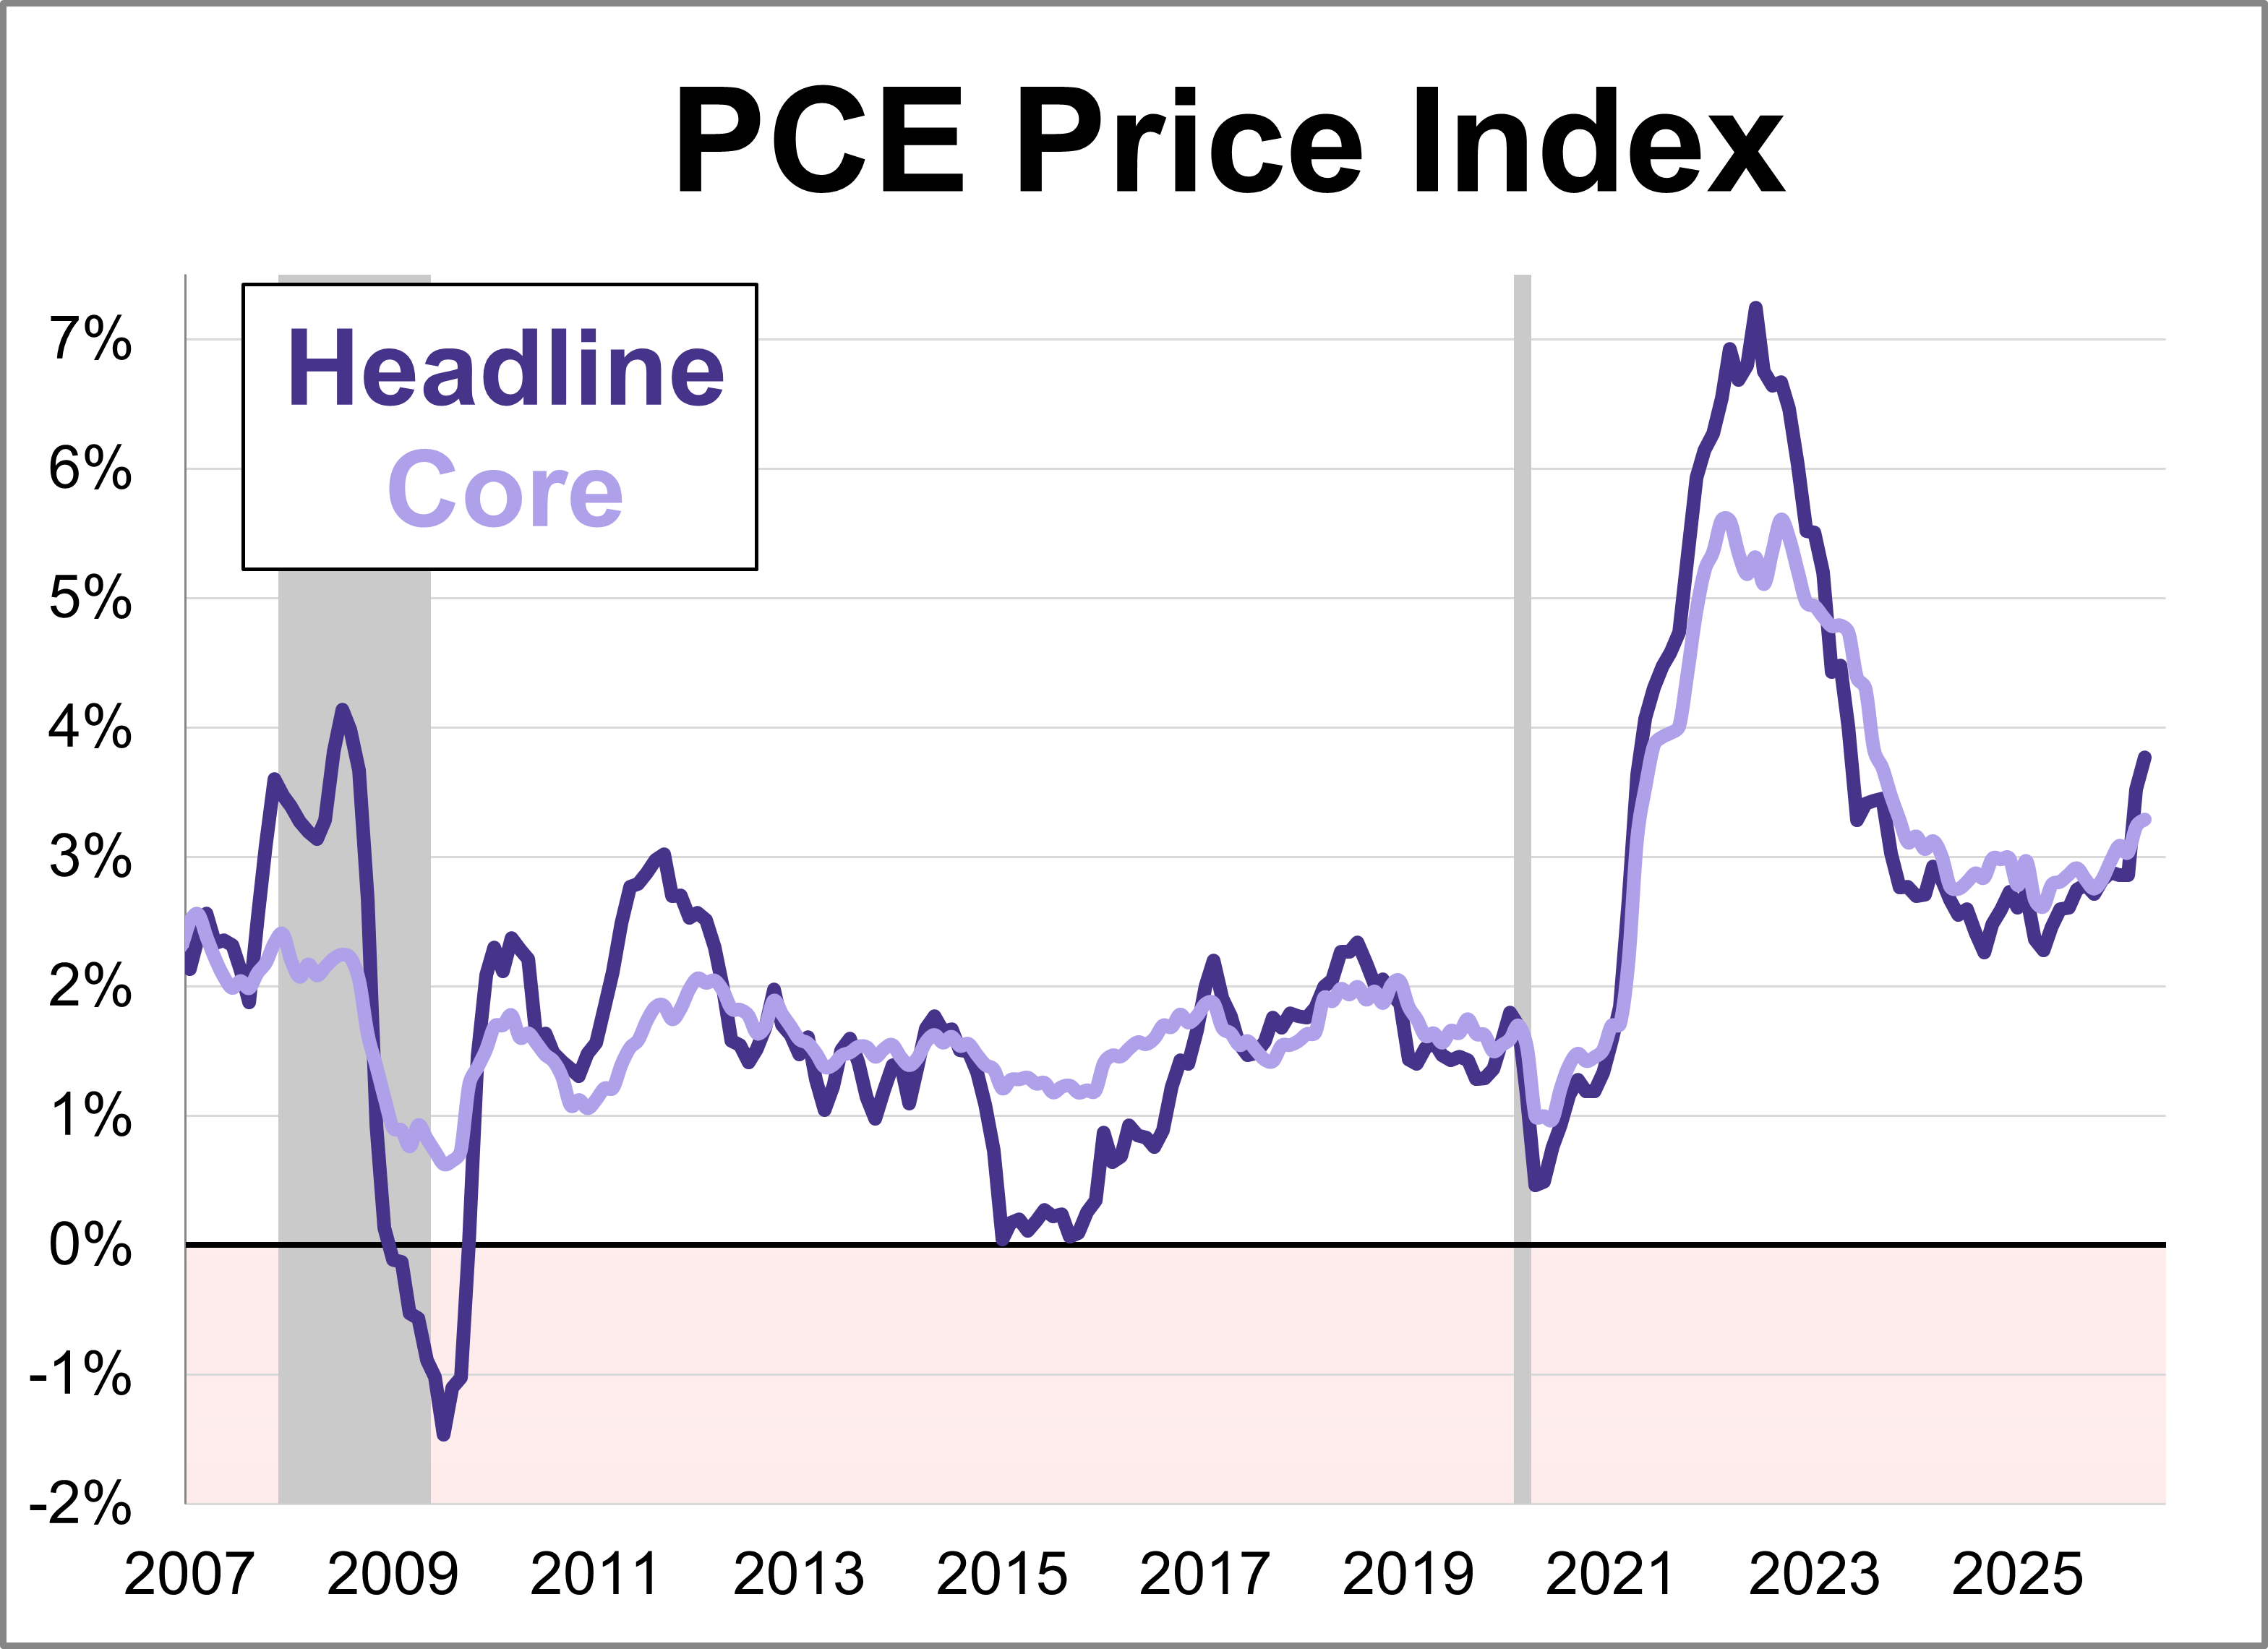
Inflation remains a hot topic, directly impacting everything from your grocery bill to interest rates. As of the latest data, two key inflation gauges — the Personal Consumption Expenditures (PCE) Price Index and the Consumer Price Index (CPI) — show that prices are still above the Federal Reserve's 2% target, with the core PCE at 3.3% and core CPI at 2.8%.
Personal income (excluding transfer receipts) was down 0.05% in April and was up 2.68% year-over-year. However, when adjusted for inflation using the BEA's PCE Price Index, real personal income (excluding transfer receipts) was down 0.44% month-over-month and down 1.04% year-over-year.
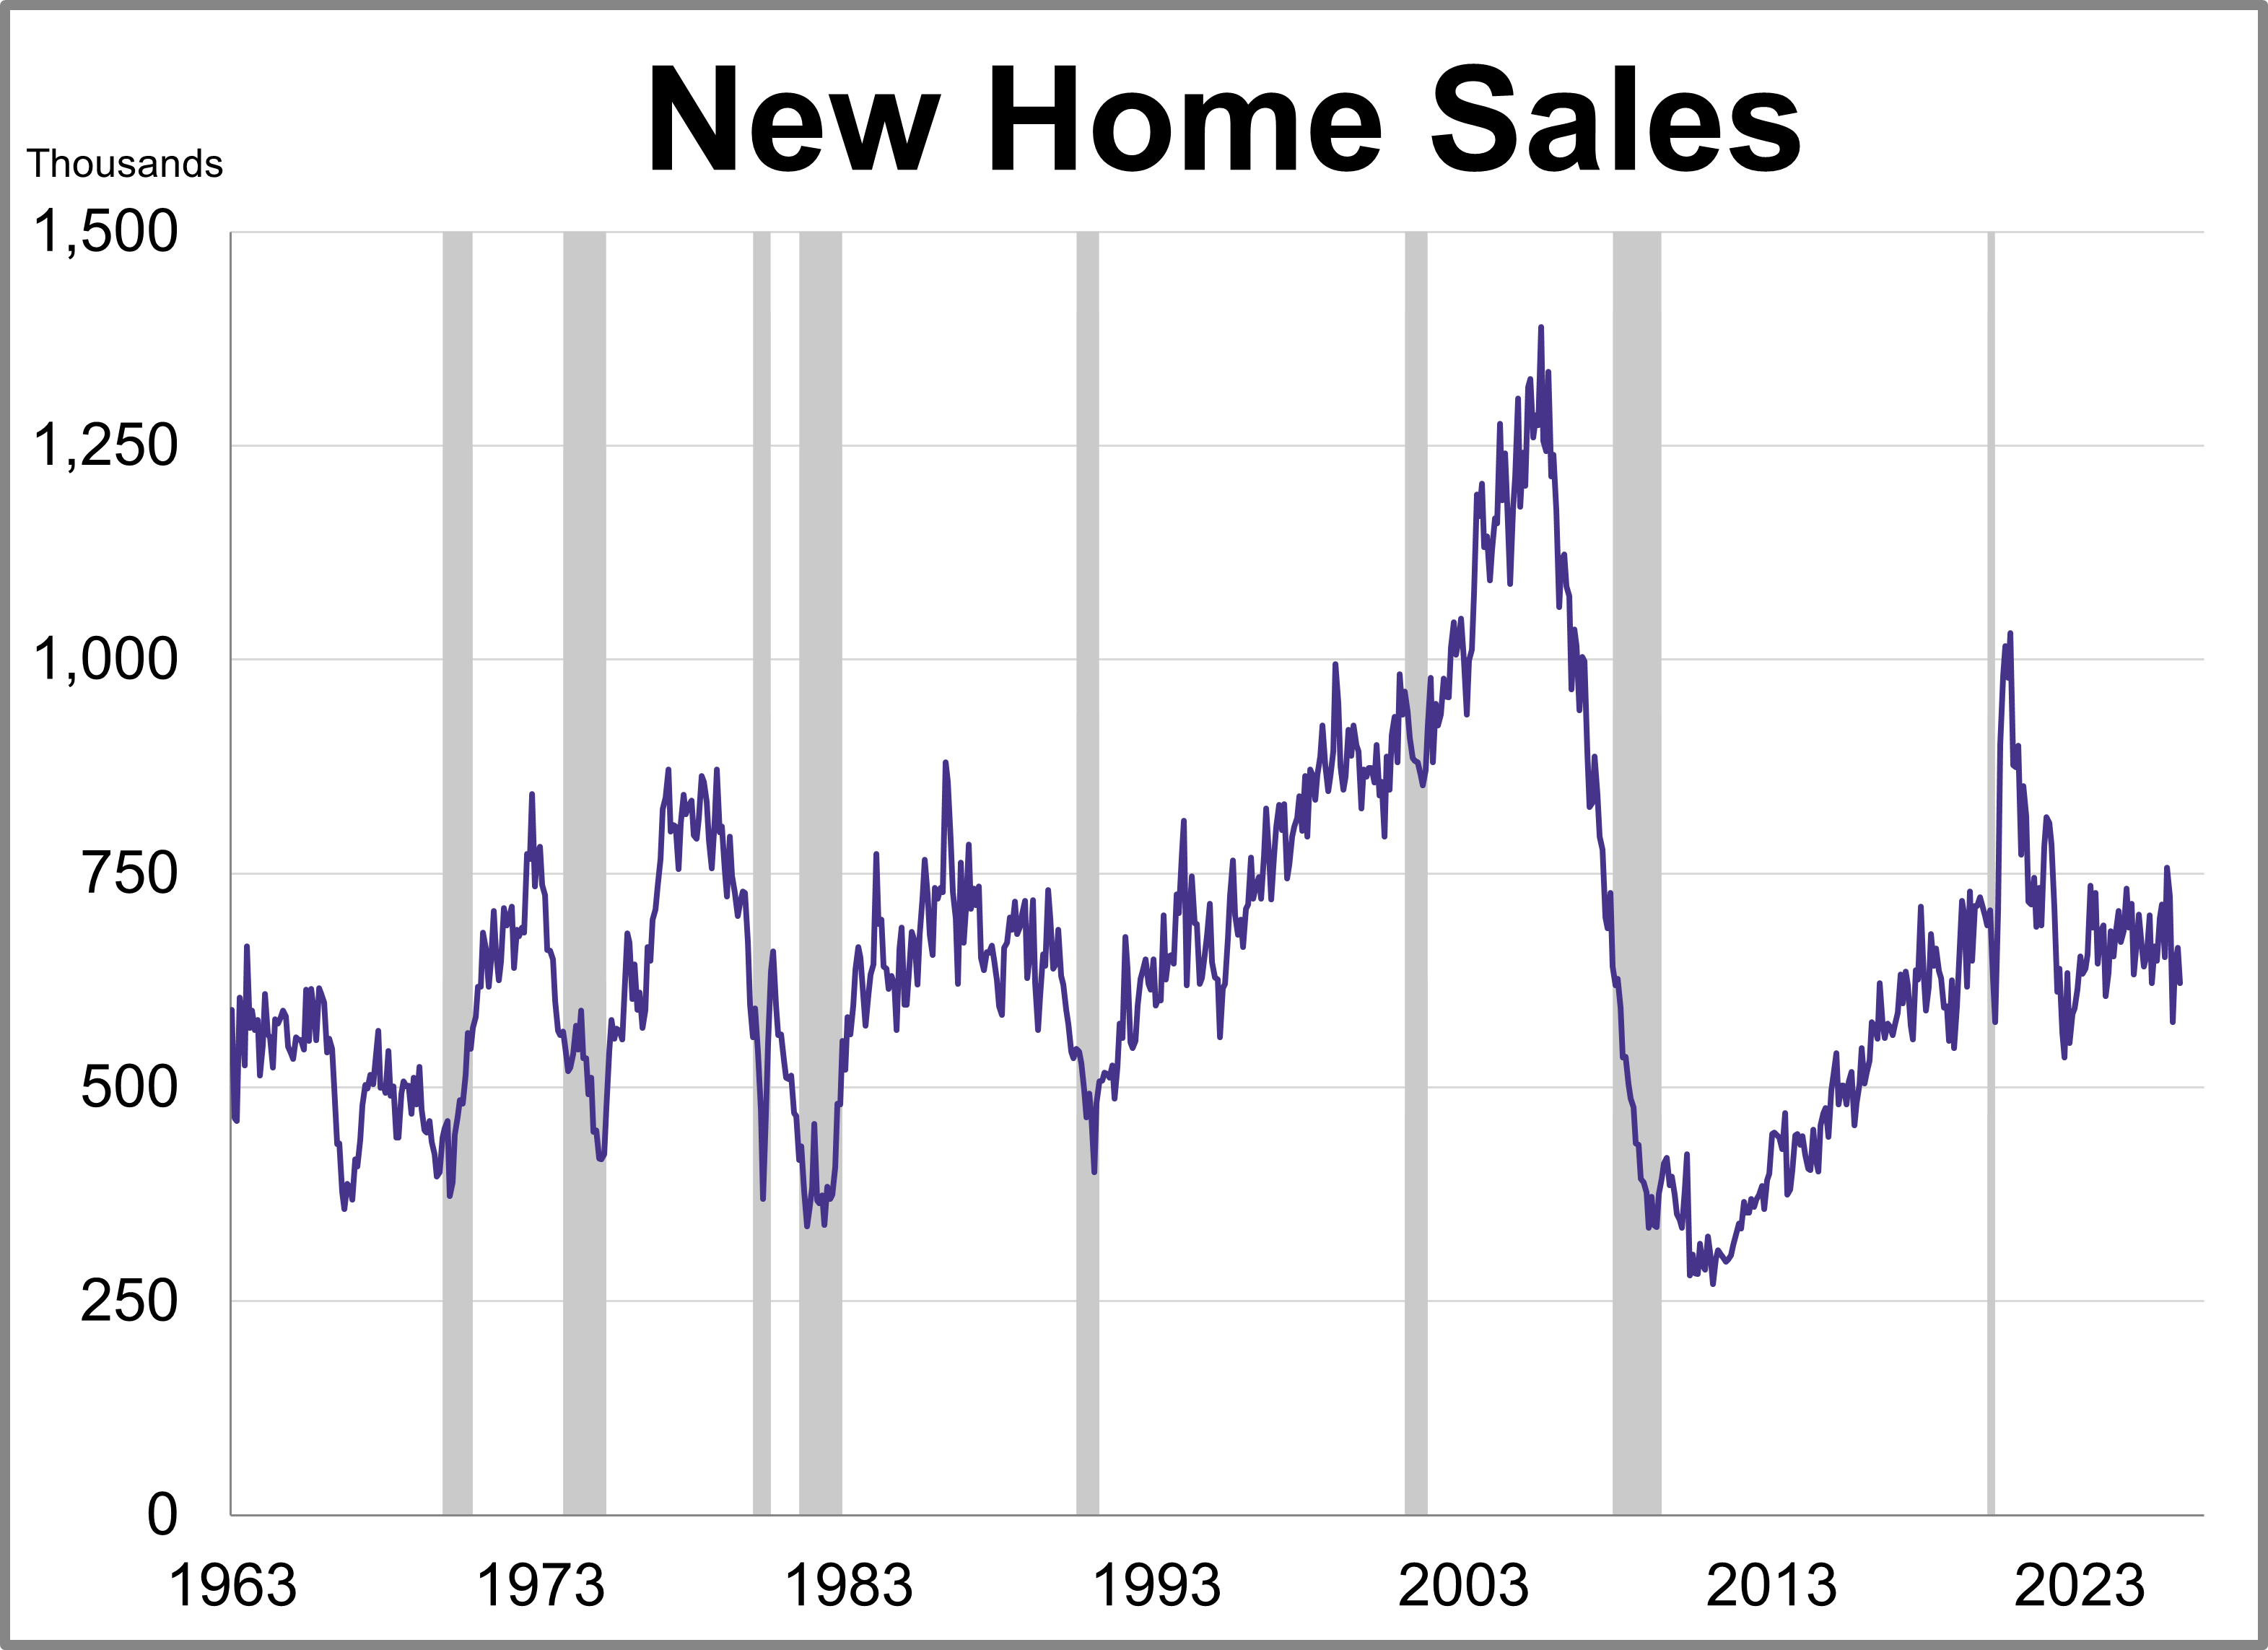
New home sales fell more than expected in April while the median price experienced its largest jump in seven years.
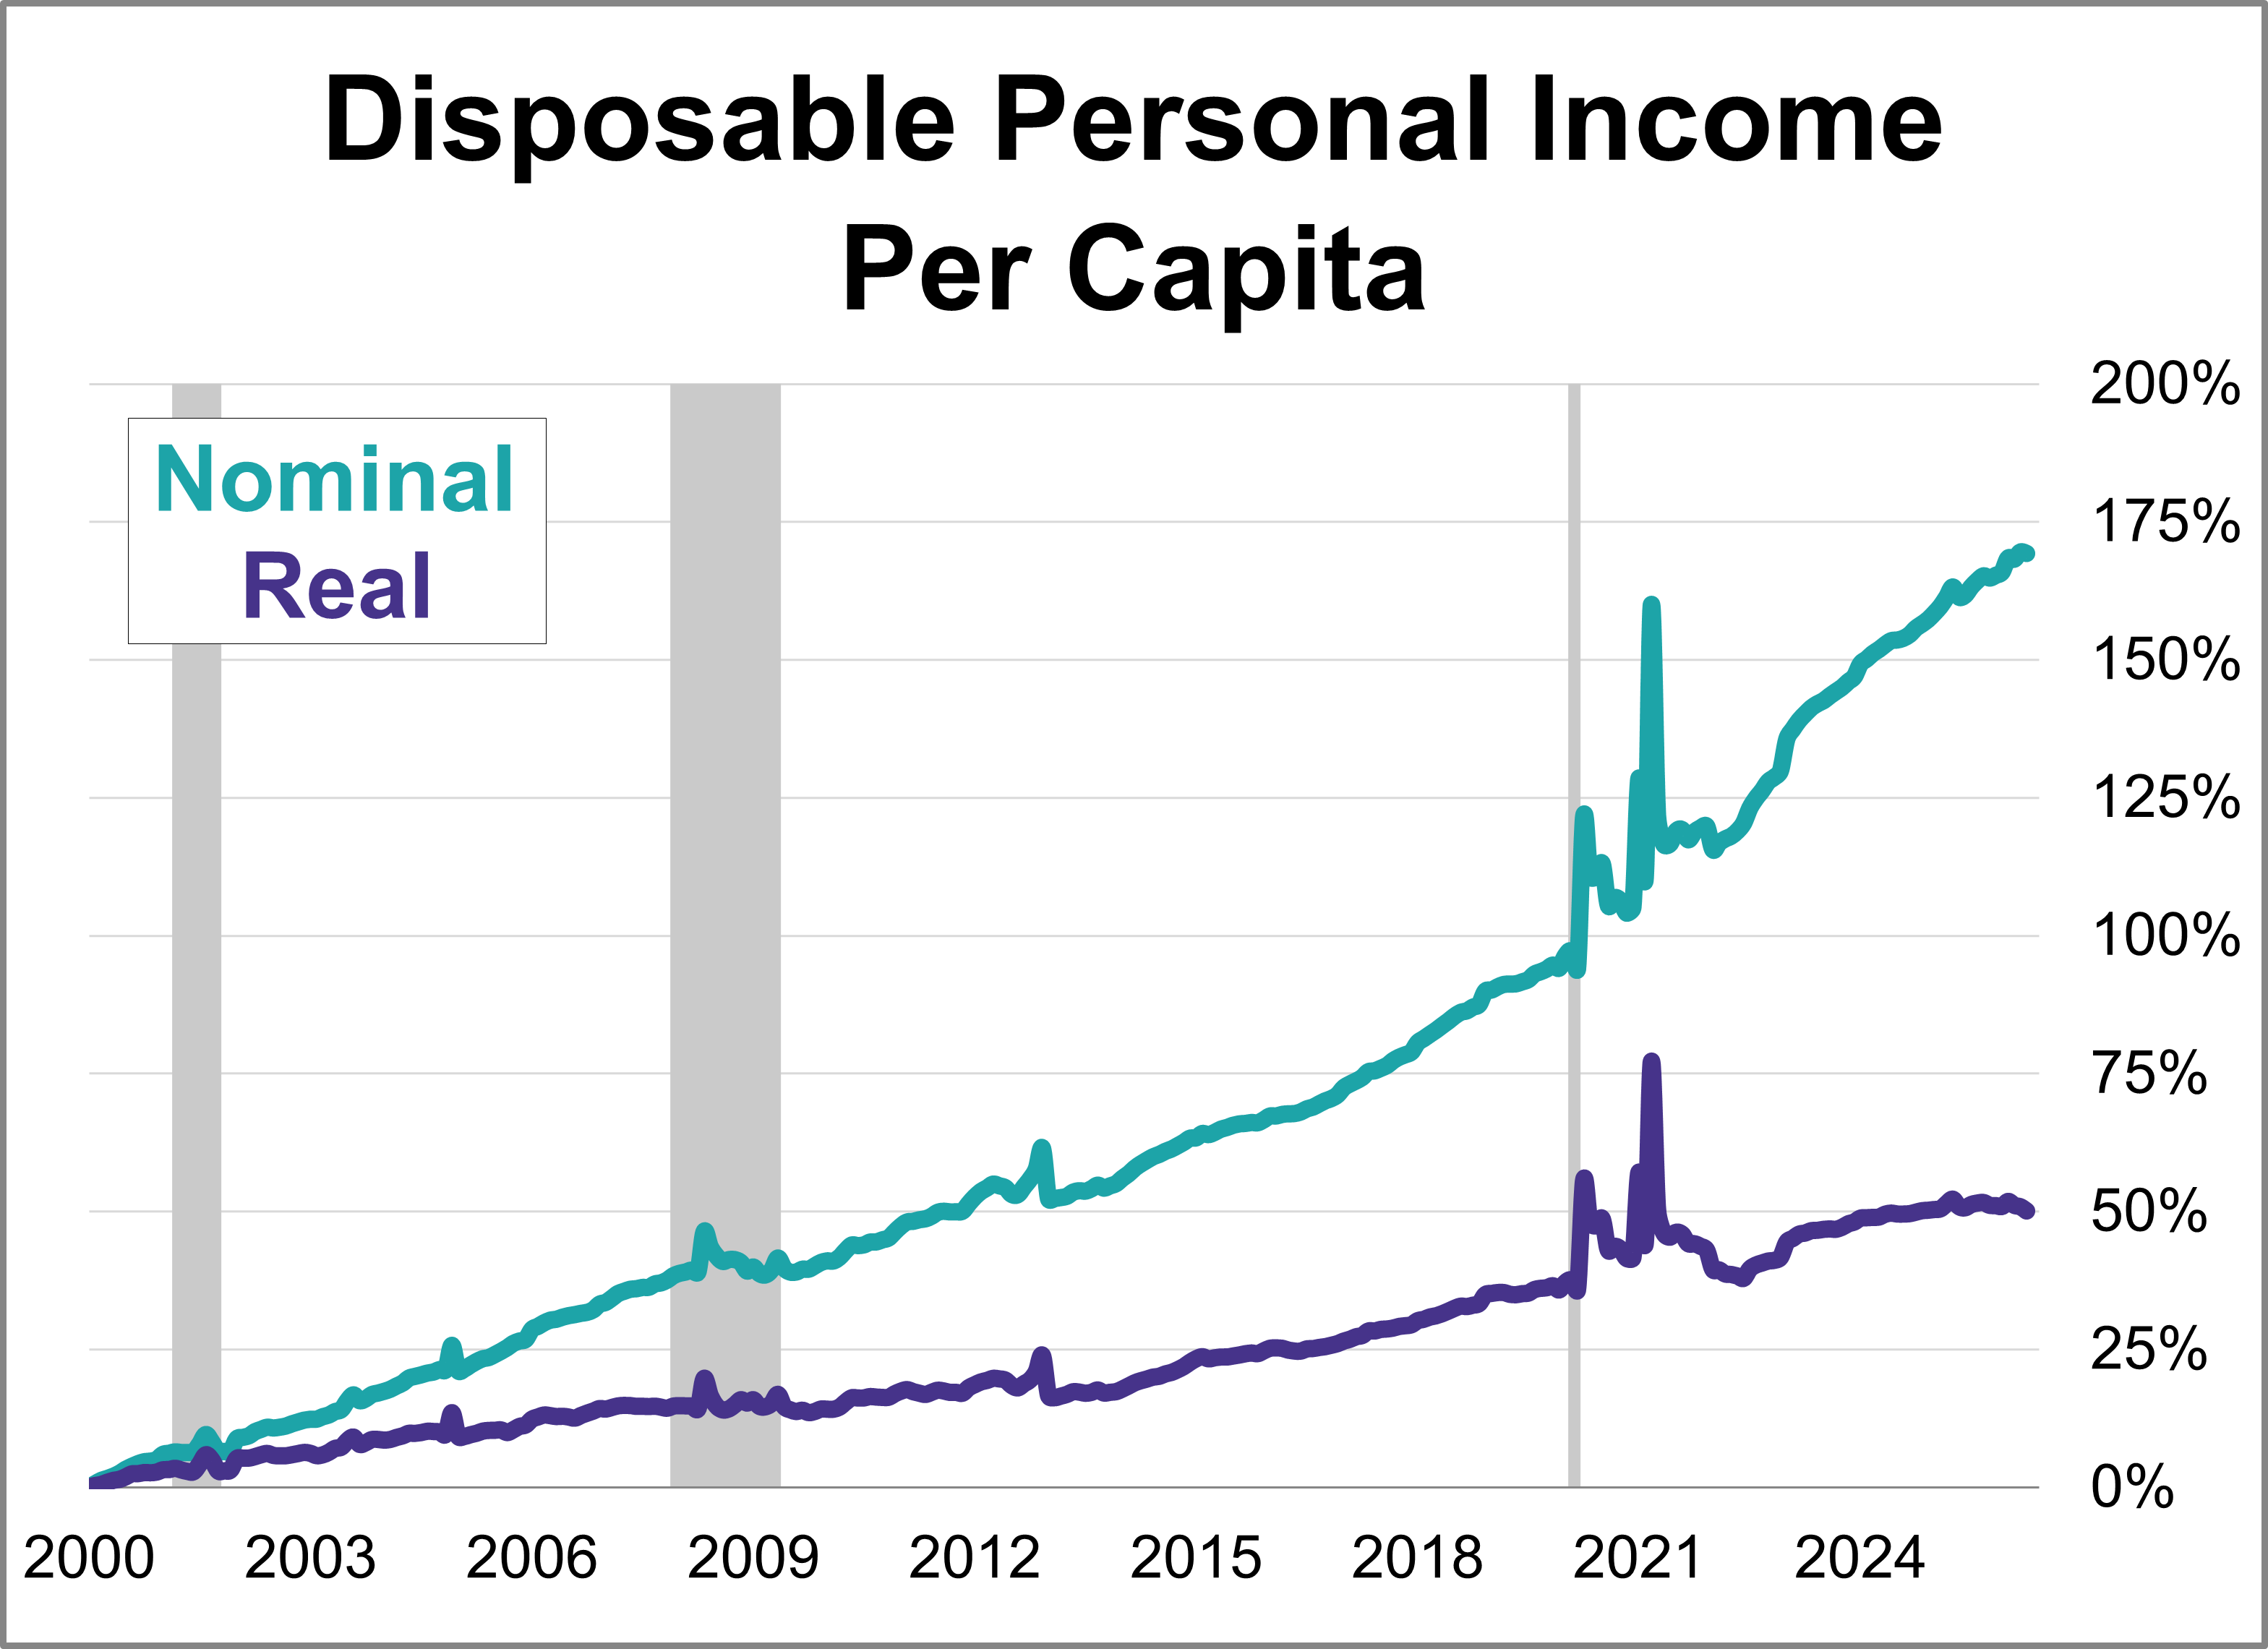
With the release of April's report on personal incomes and outlays, we can now take a closer look at "real" disposable personal income per capita. To two decimal places, disposable income per capita was up down 0.10% month-over-month. But when adjusted for inflation, real disposable income per capita was down 0.50%.
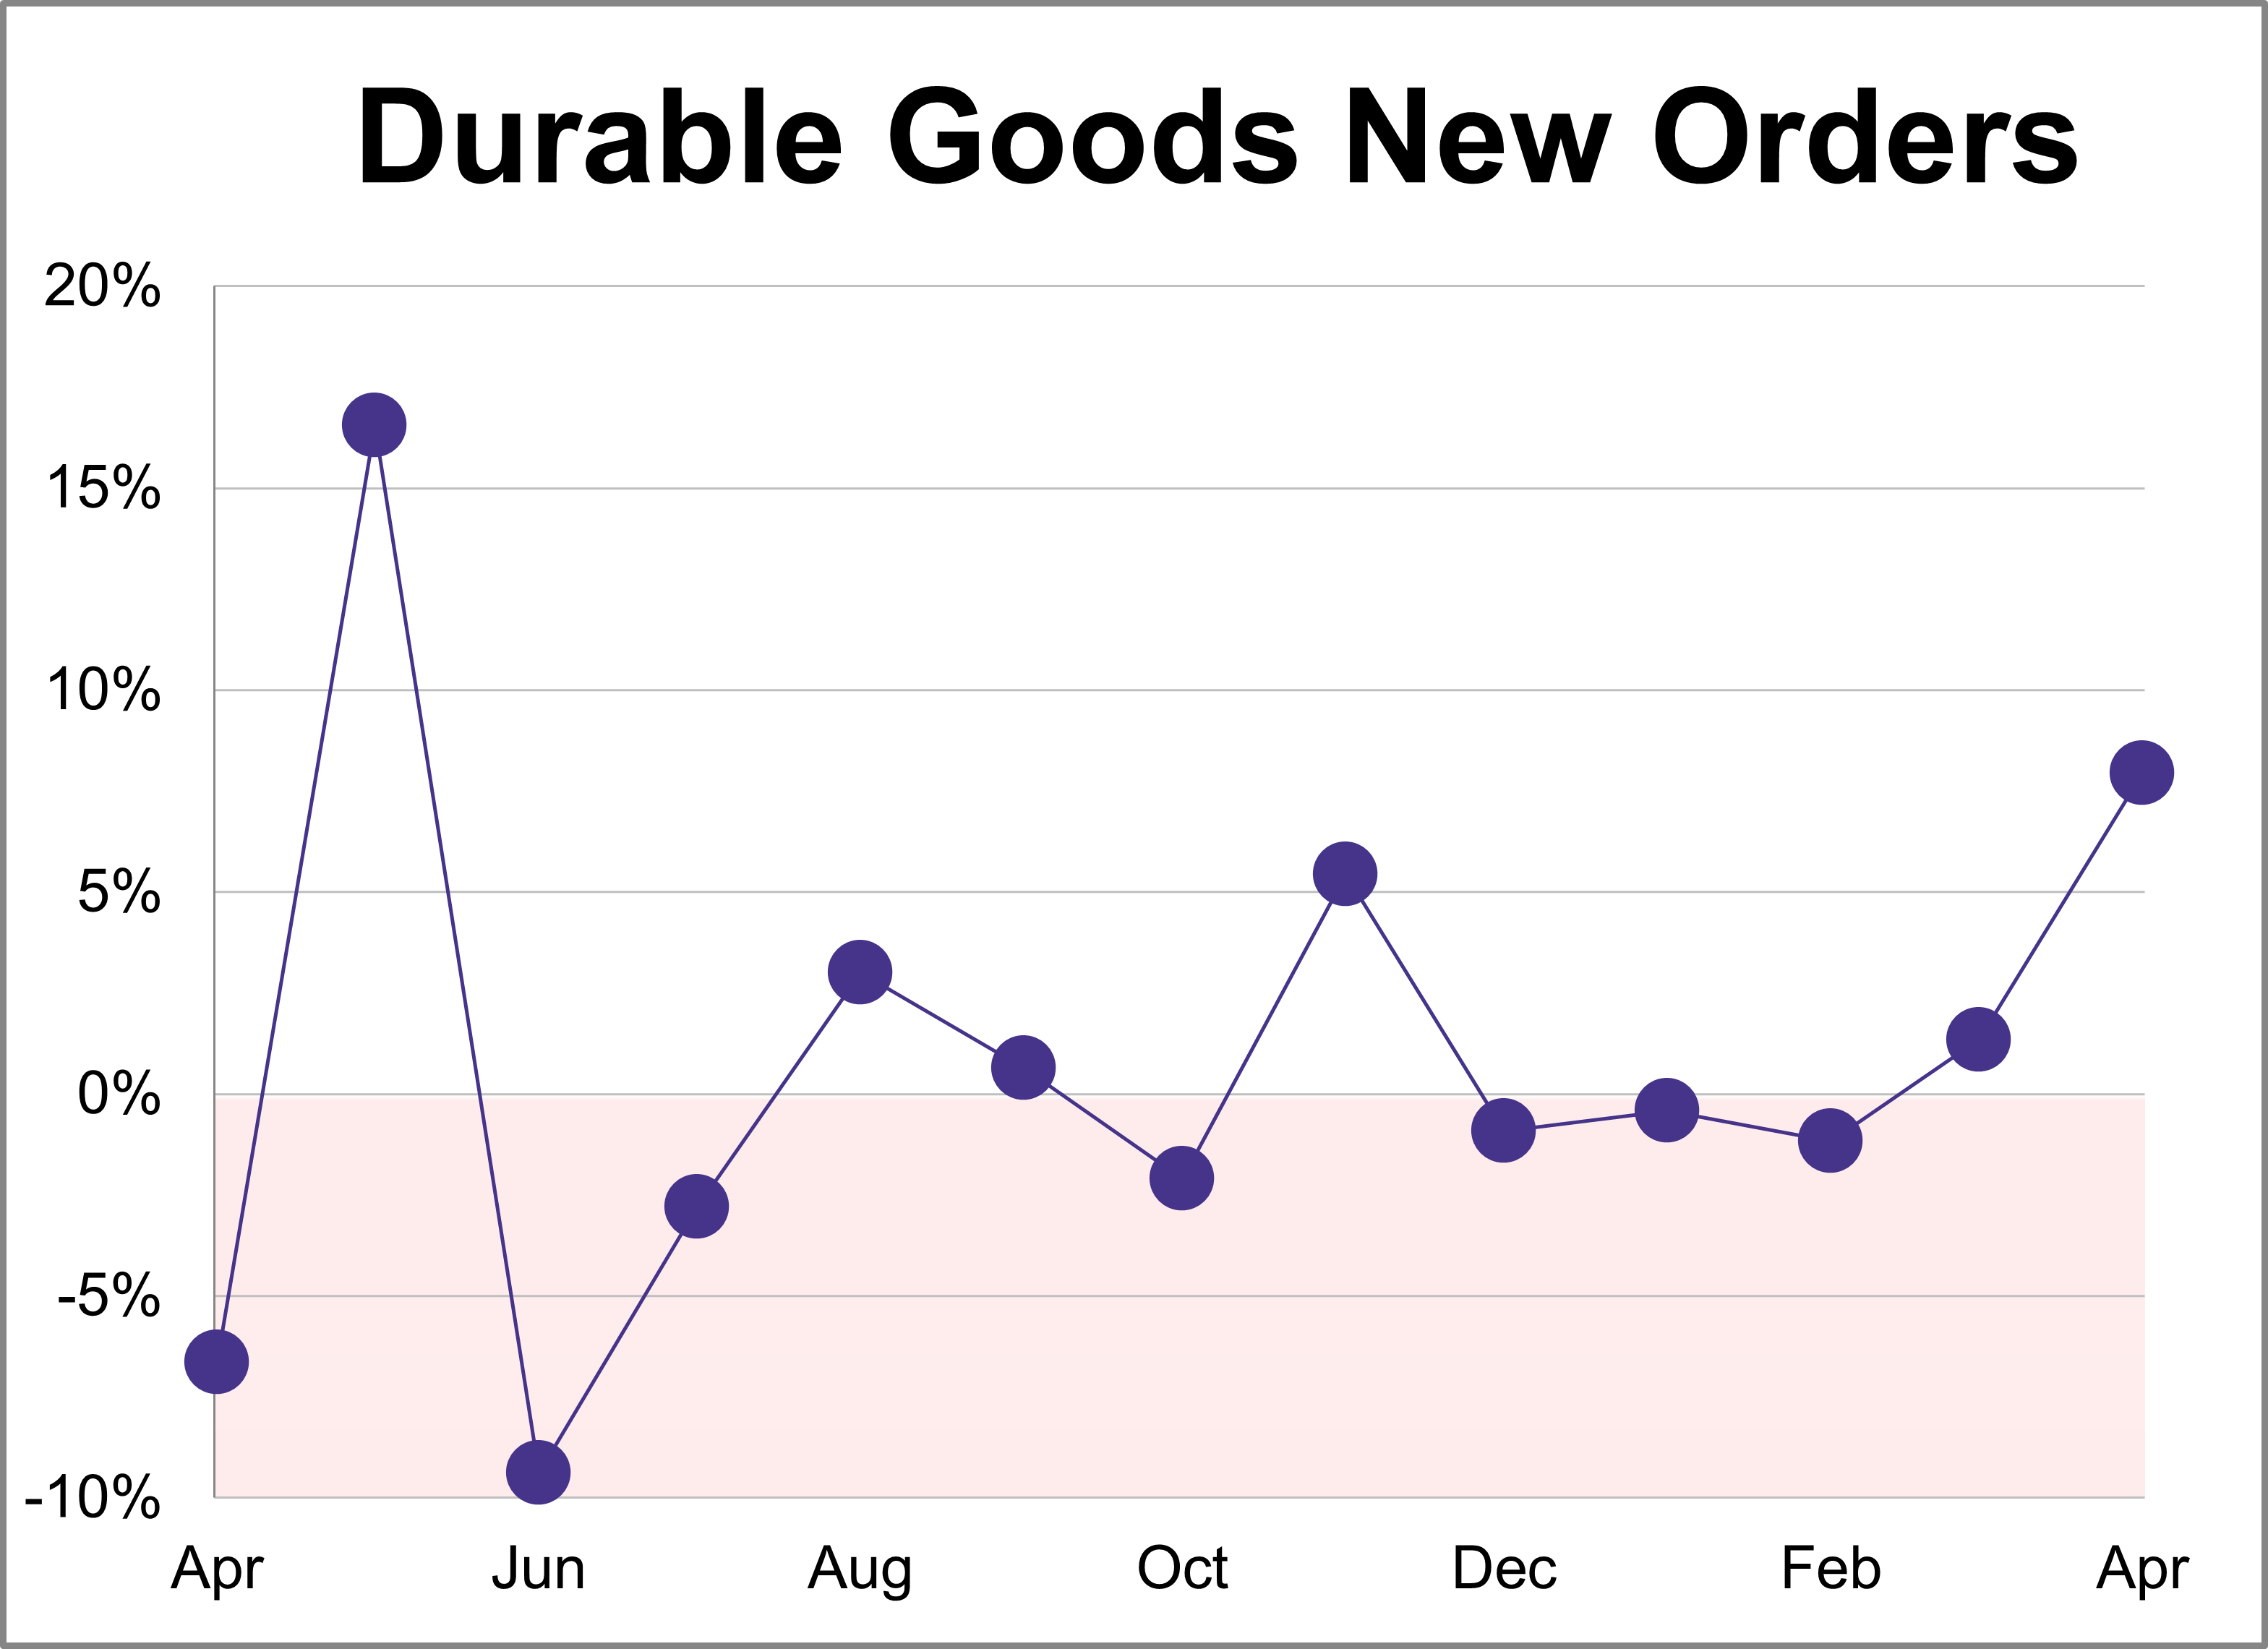
New orders for manufactured durable goods jumped 7.9% in April to $345.96B, almost twice as much as the projected 4.0% monthly growth.
U.S. economic growth rebounded at the beginning of 2026, according to the BEA’s latest estimate. Real GDP rose at 1.6% annual rate in Q1, falling short of the 2.0% forecast but marking an acceleration from the 0.5% final estimate seen in Q4 of last year.
The Federal Reserve’s preferred inflation gauge, the core PCE price index, climbed 3.3% year-over-year in April. This marks the highest level since November 2023 and marks a steady pickup from March's 3.2% reading. On a monthly basis, core prices rose 0.2%.
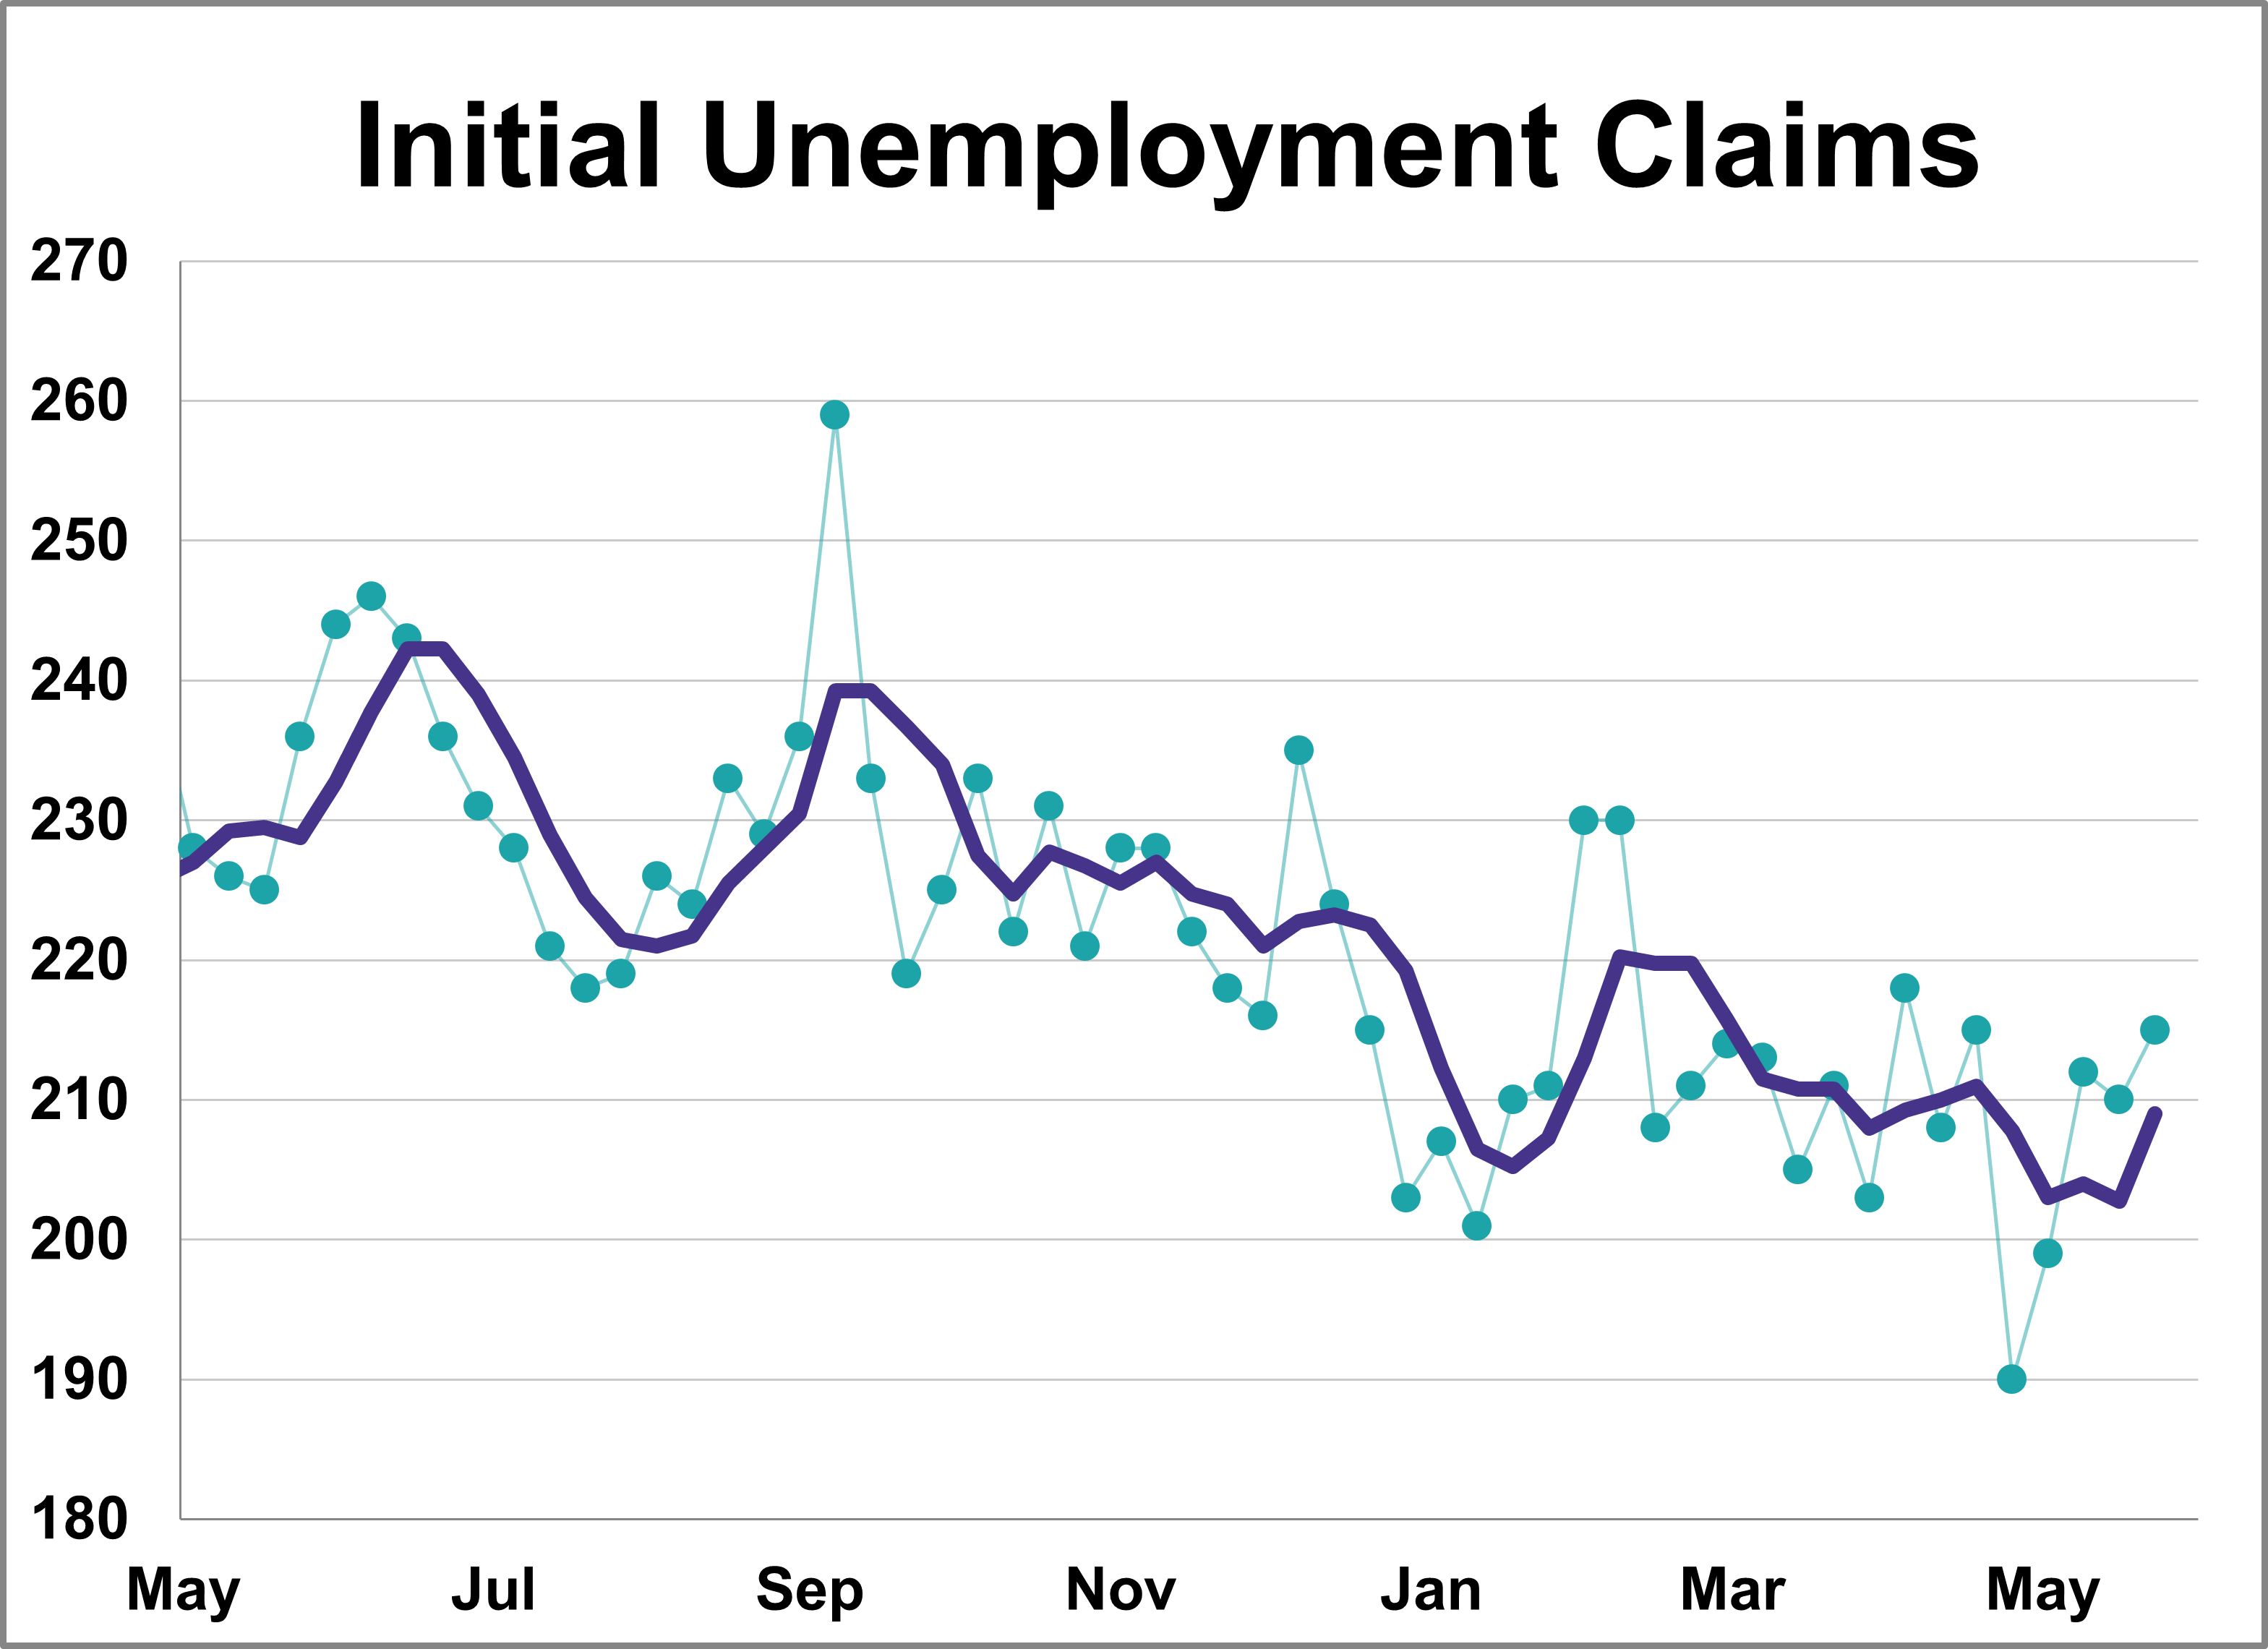
In the week ending May 23rd, initial jobless claims were at a seasonally adjusted level of 215,000. This represents an increase of 5,000 from the previous week's figure and was higher than the forecast of 211,000.
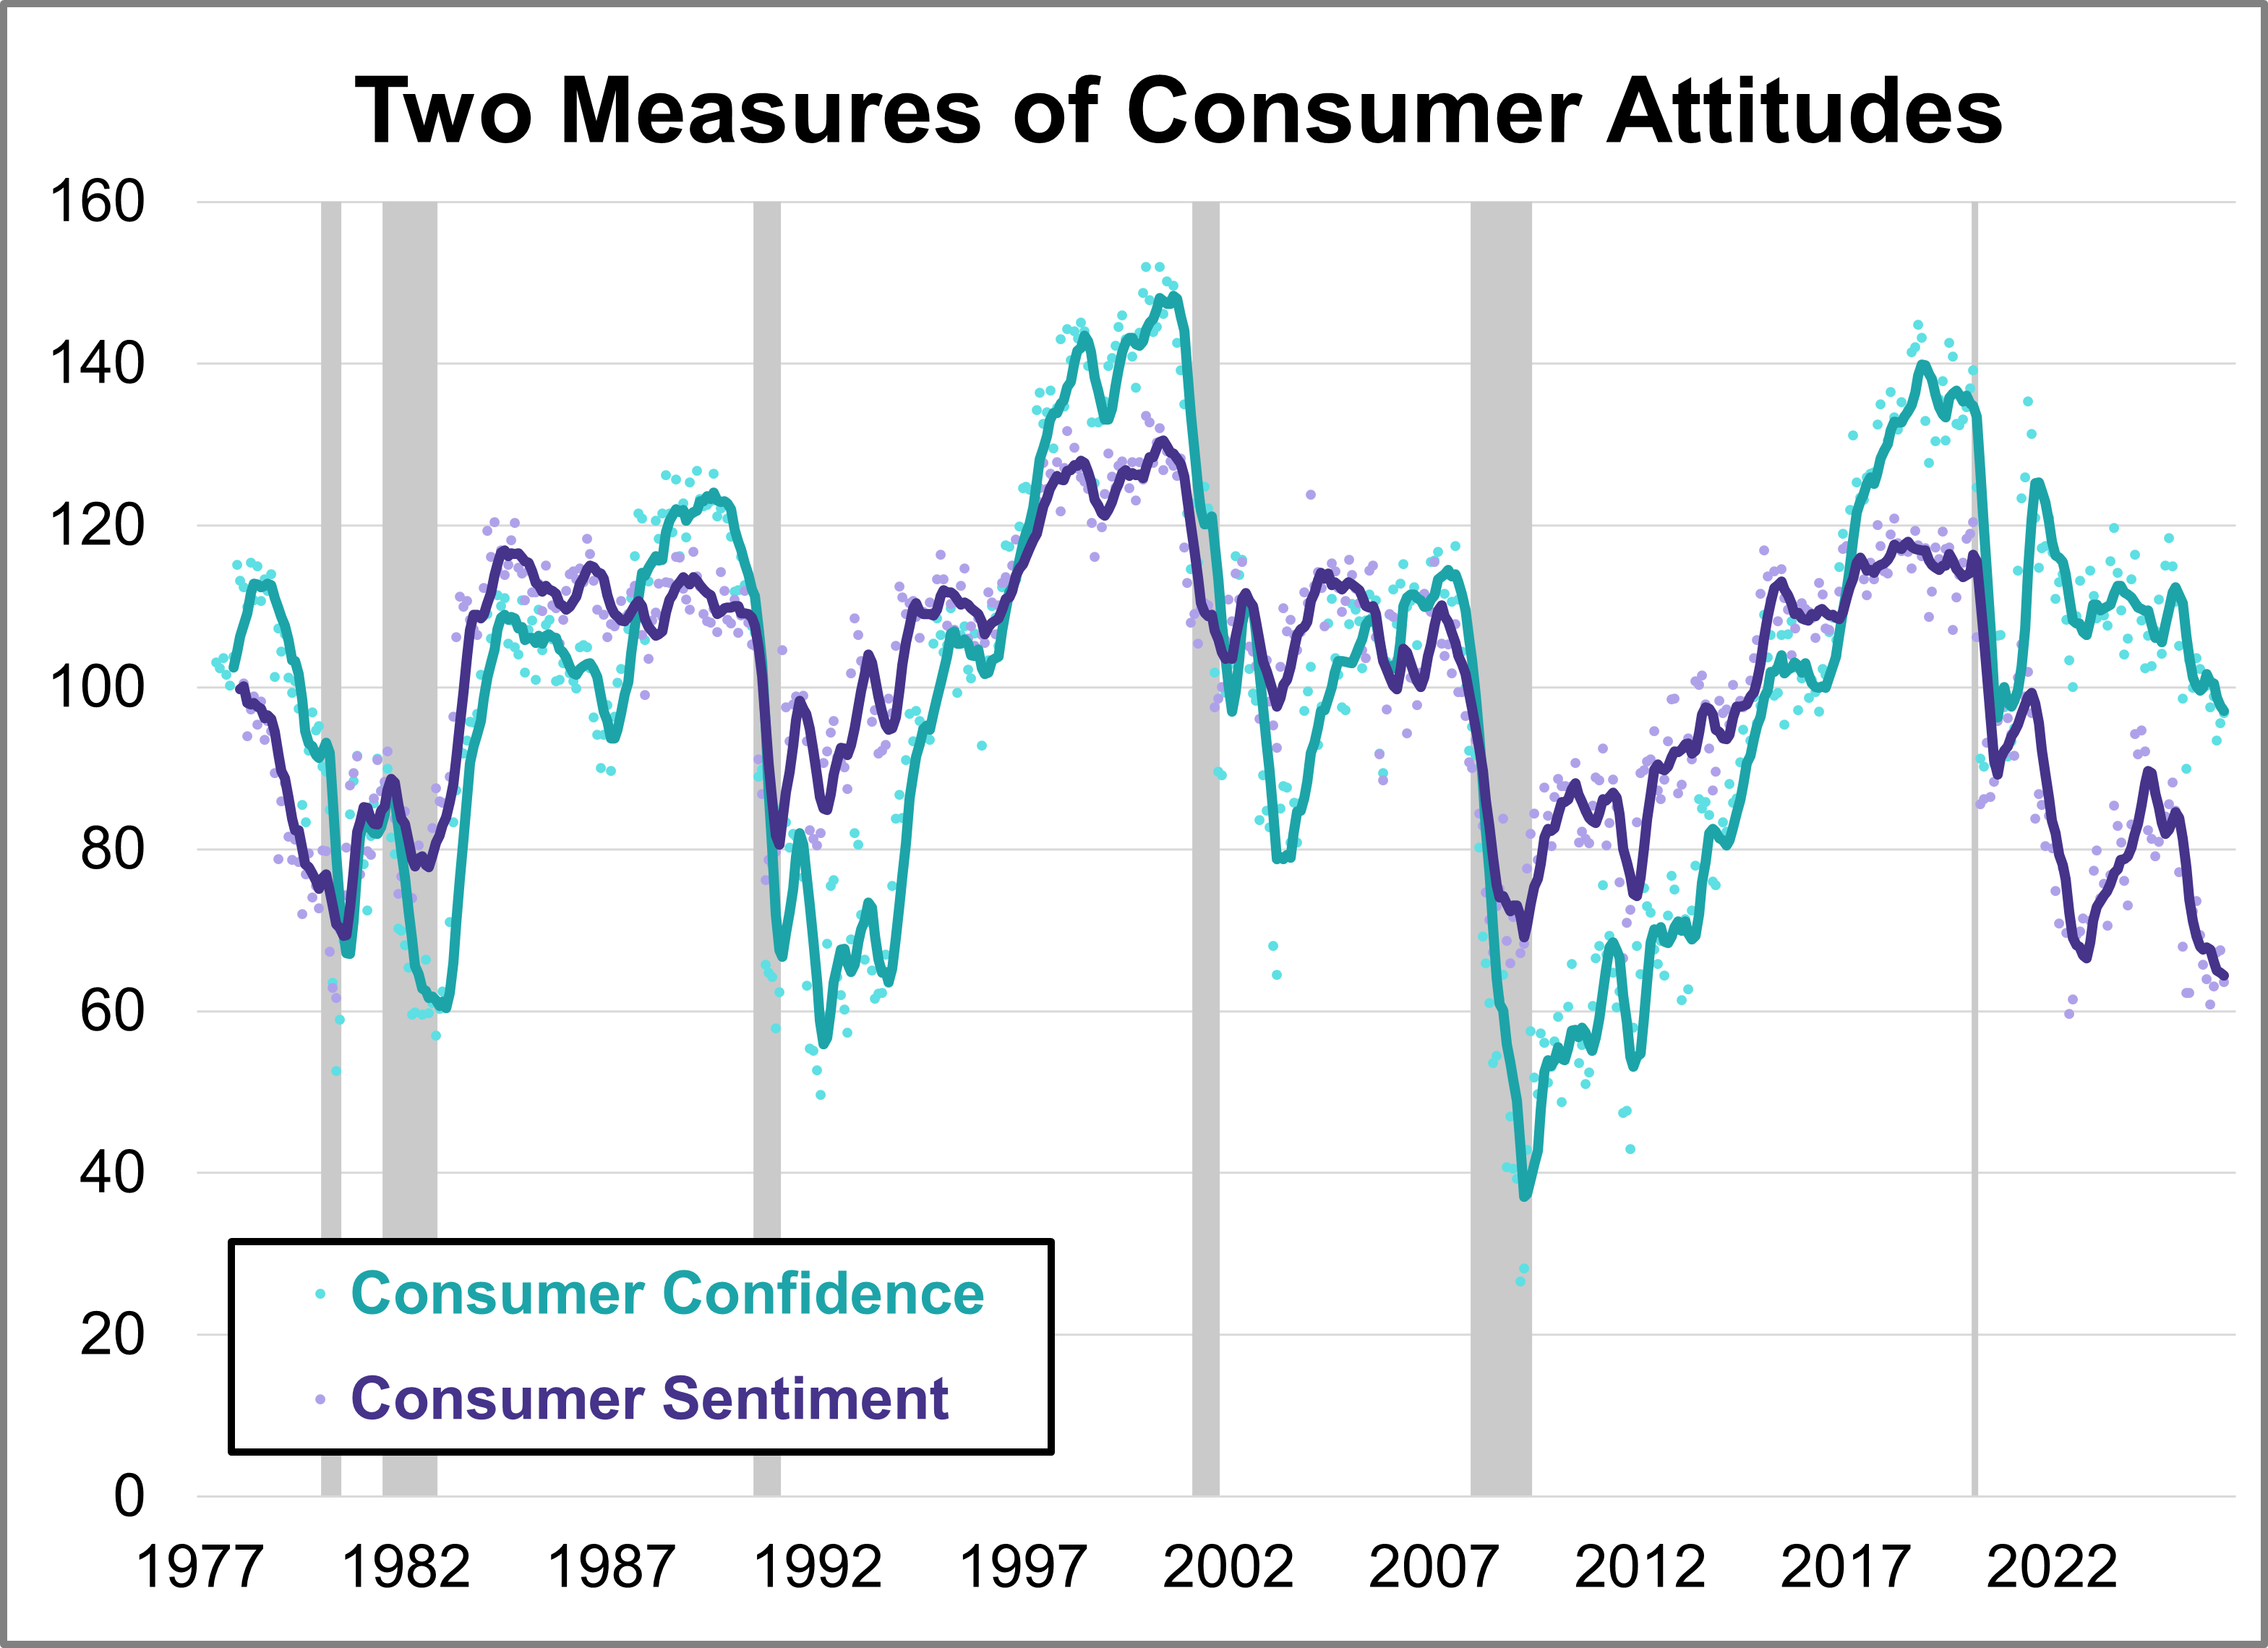
What are consumers thinking about the economy? Their collective mood offers crucial clues for businesses, investors, and policymakers alike. In May, the two leading benchmarks, the University of Michigan’s Consumer Sentiment Index (MCSI) and the Conference Board’s Consumer Confidence Index (CCI), offered similar views with both retreating amid ongoing inflation concerns.
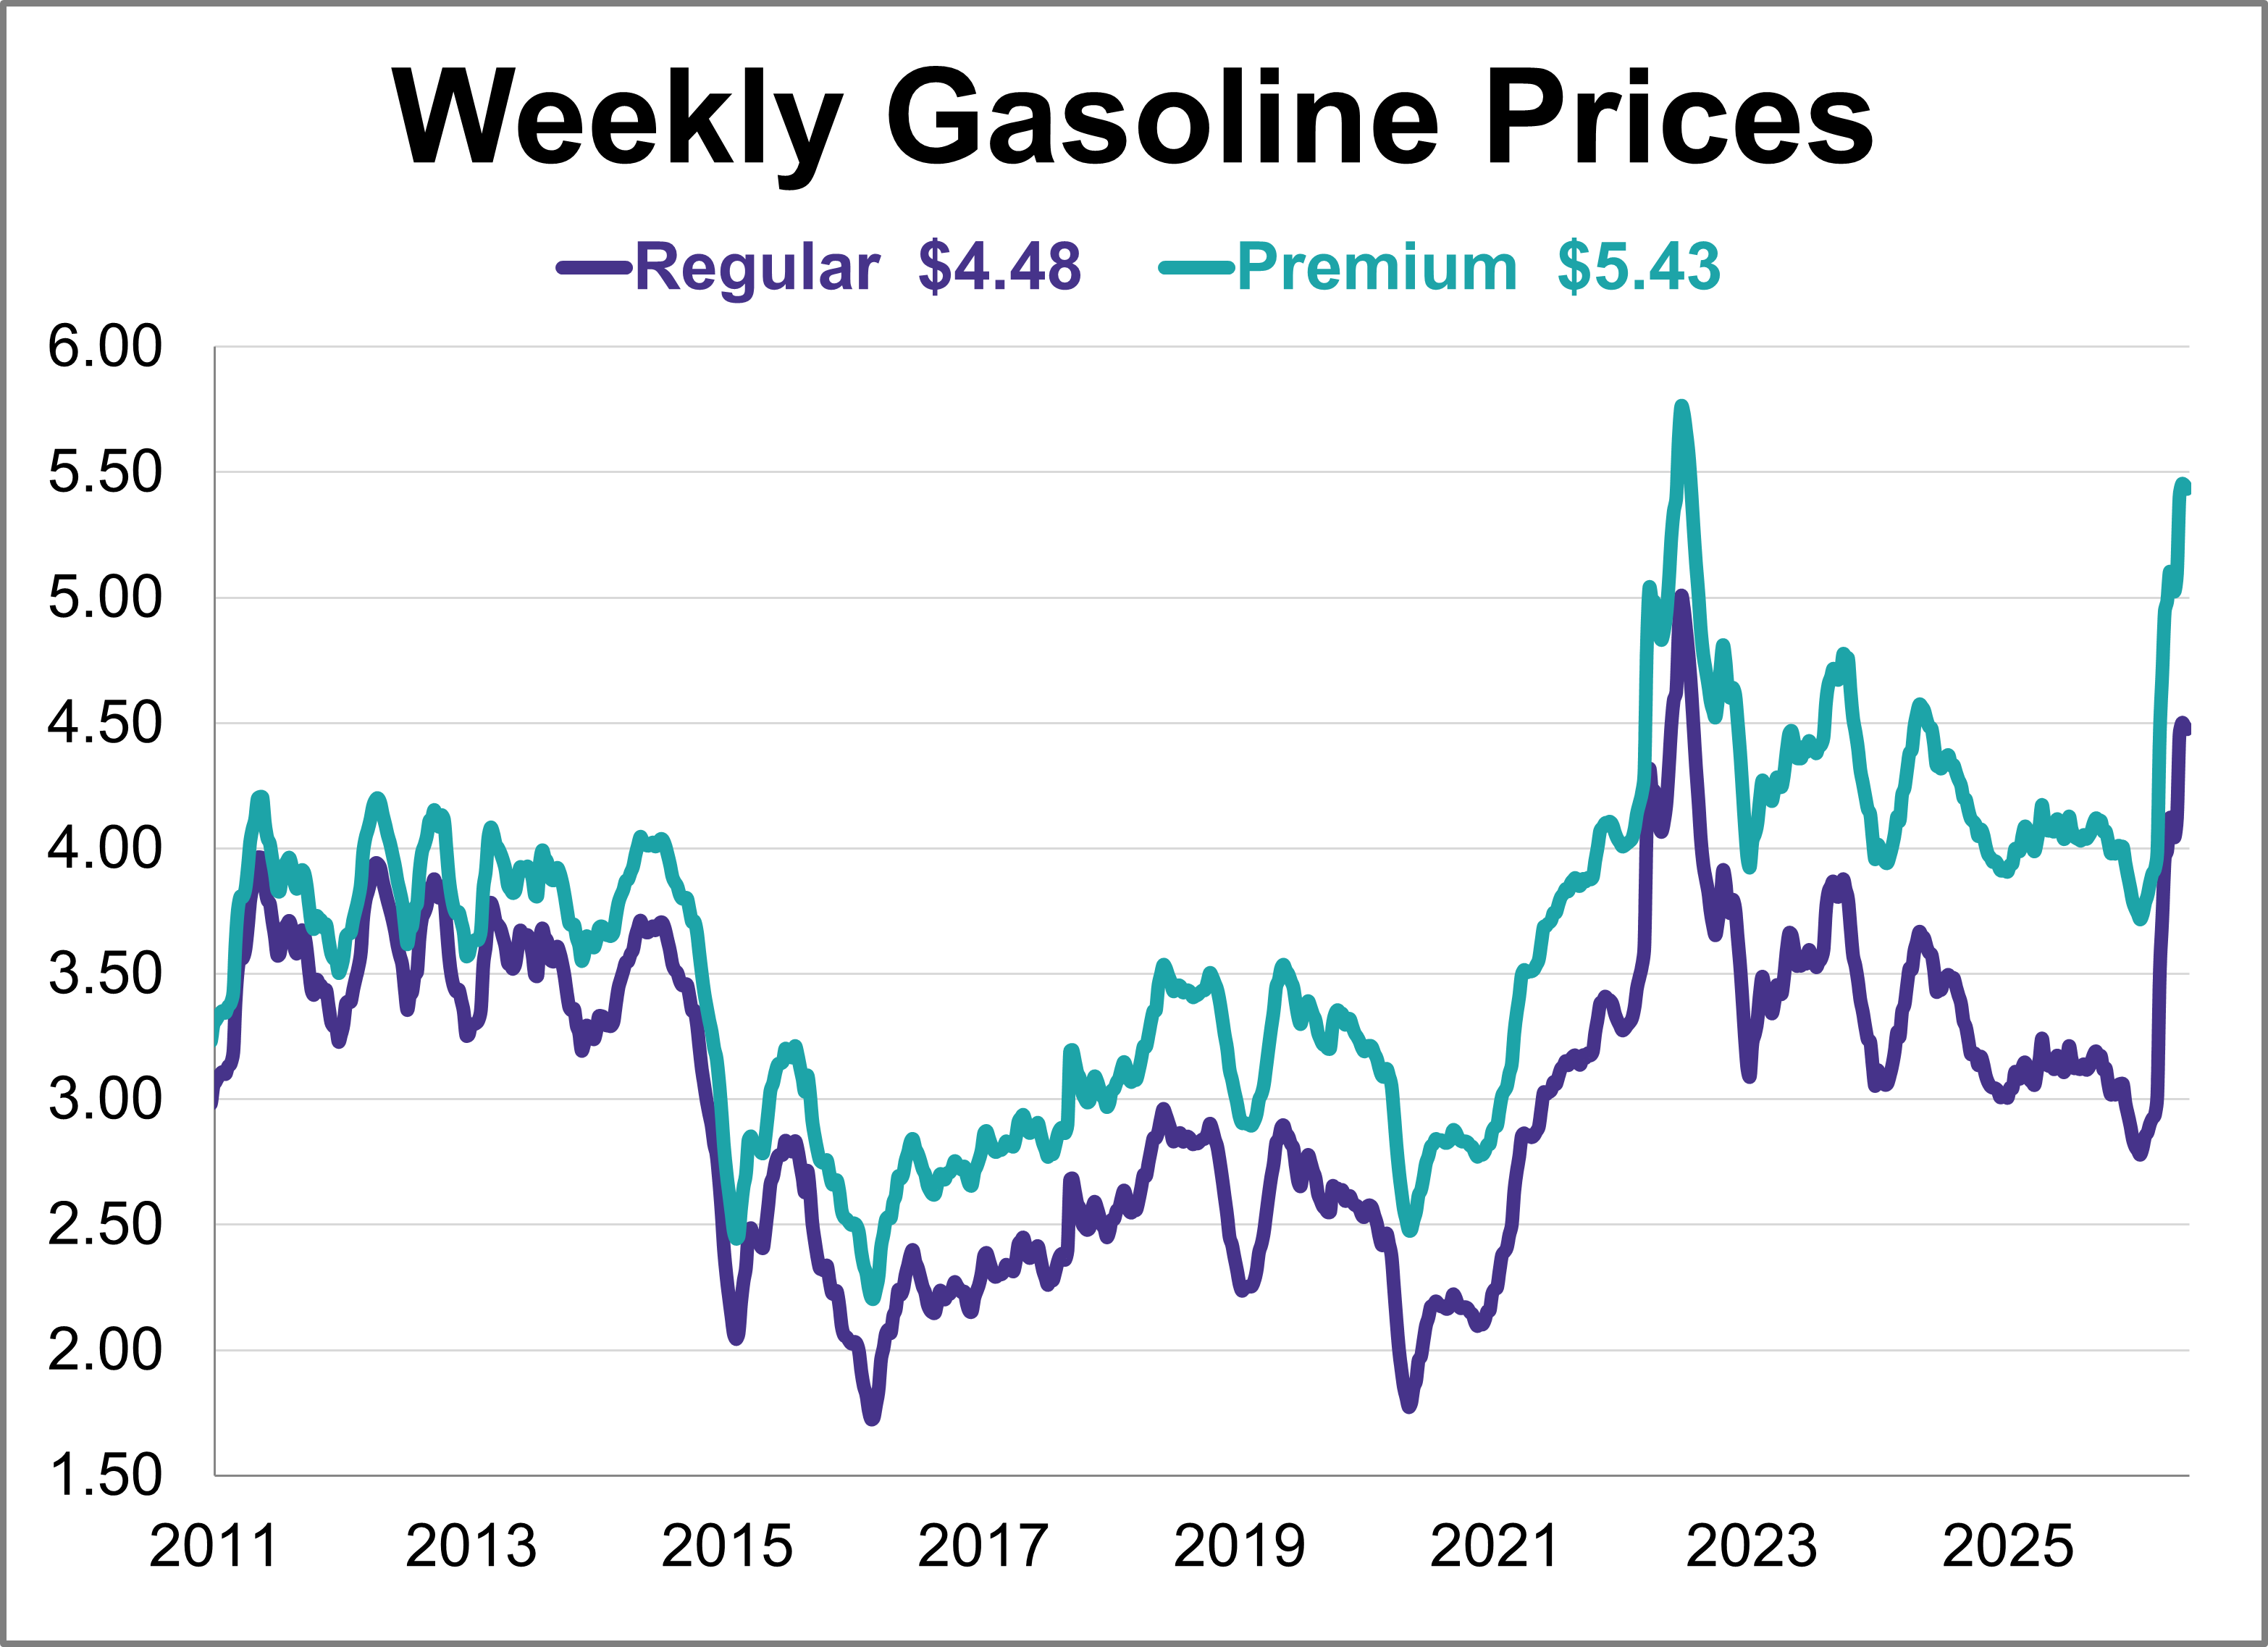
Gas prices inched lower for a second straight week though remain near their highest level in almost four years. As of May 25th, weekly prices were down 2 cents for regular and premium gasoline.
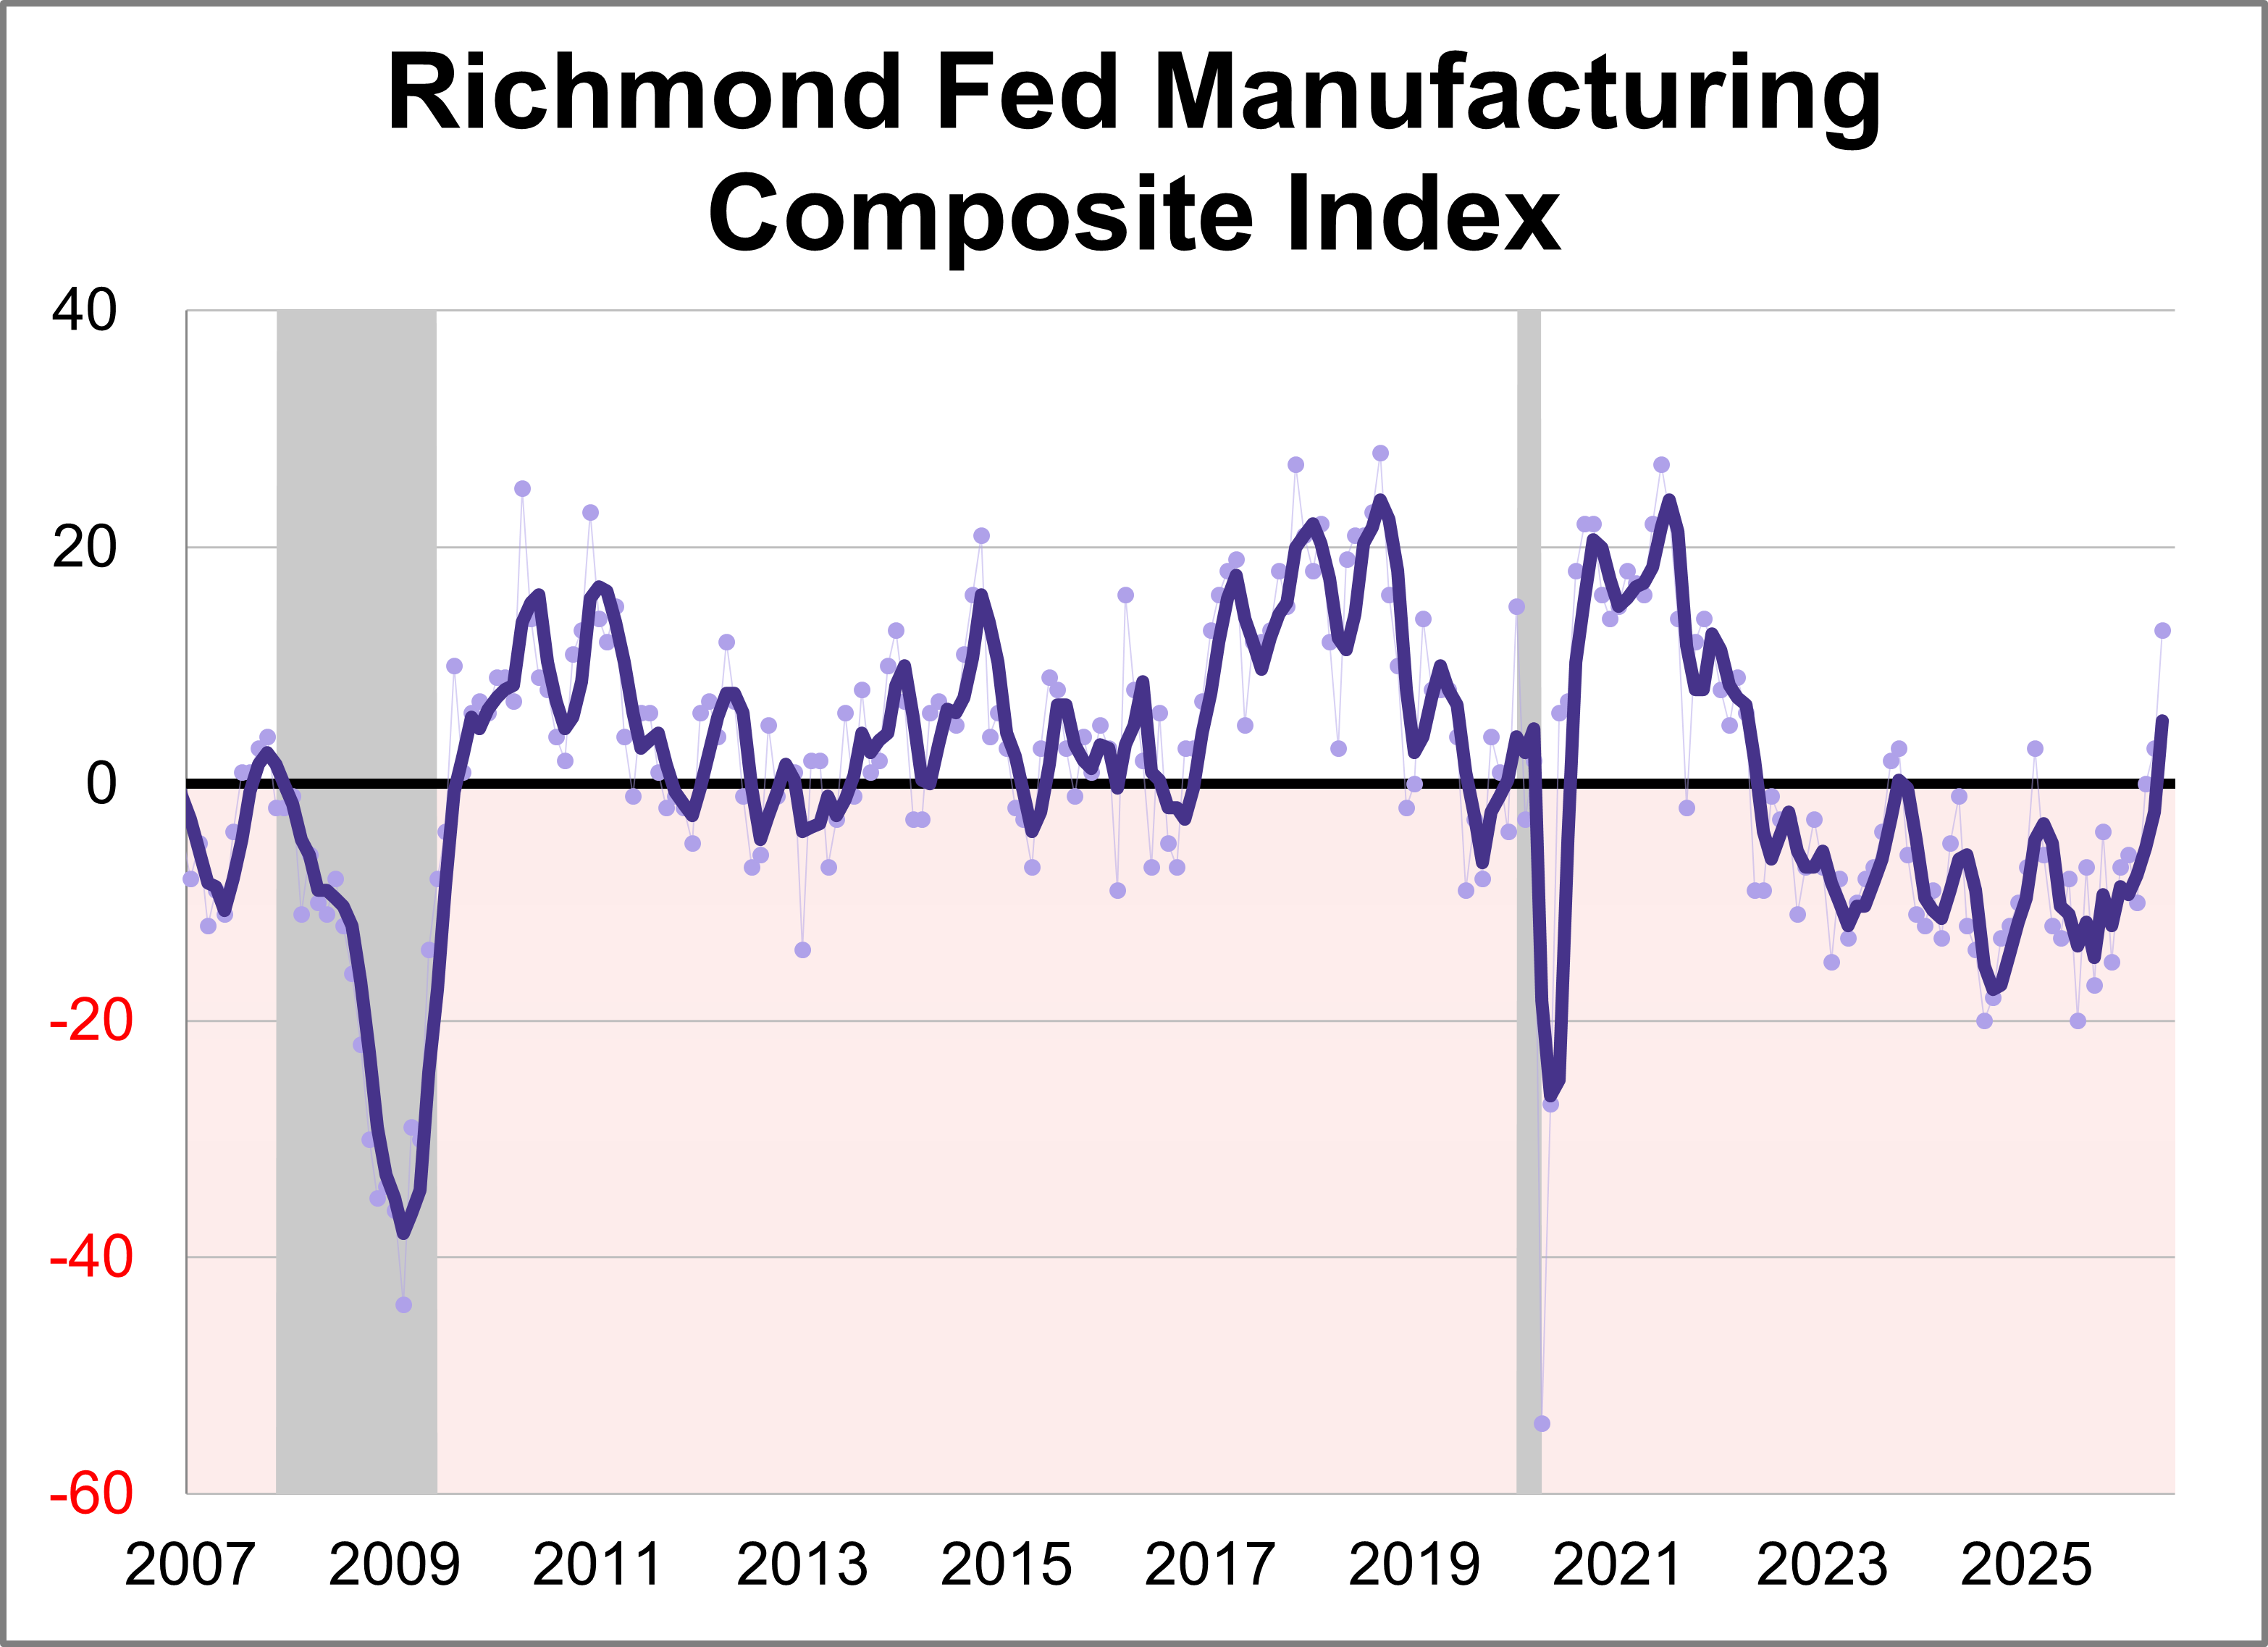
Fifth district manufacturing activity increased in May according to the most recent survey from the Federal Reserve Bank of Richmond. The composite manufacturing index rose ten points points to 13, marking the highest level in nearly five years. This month's reading was above the forecast of 4.
Bitcoin struggled for a second straight week, remaining below the $80,000 threshold and reaching its lowest level in over five weeks. BTC is currently down approximately 13% year-to-date and sits ~39% below its October 2025 record high.
Seven of the nine indexes on our world markets watch list posted year-to-date gains through May 26, 2026.
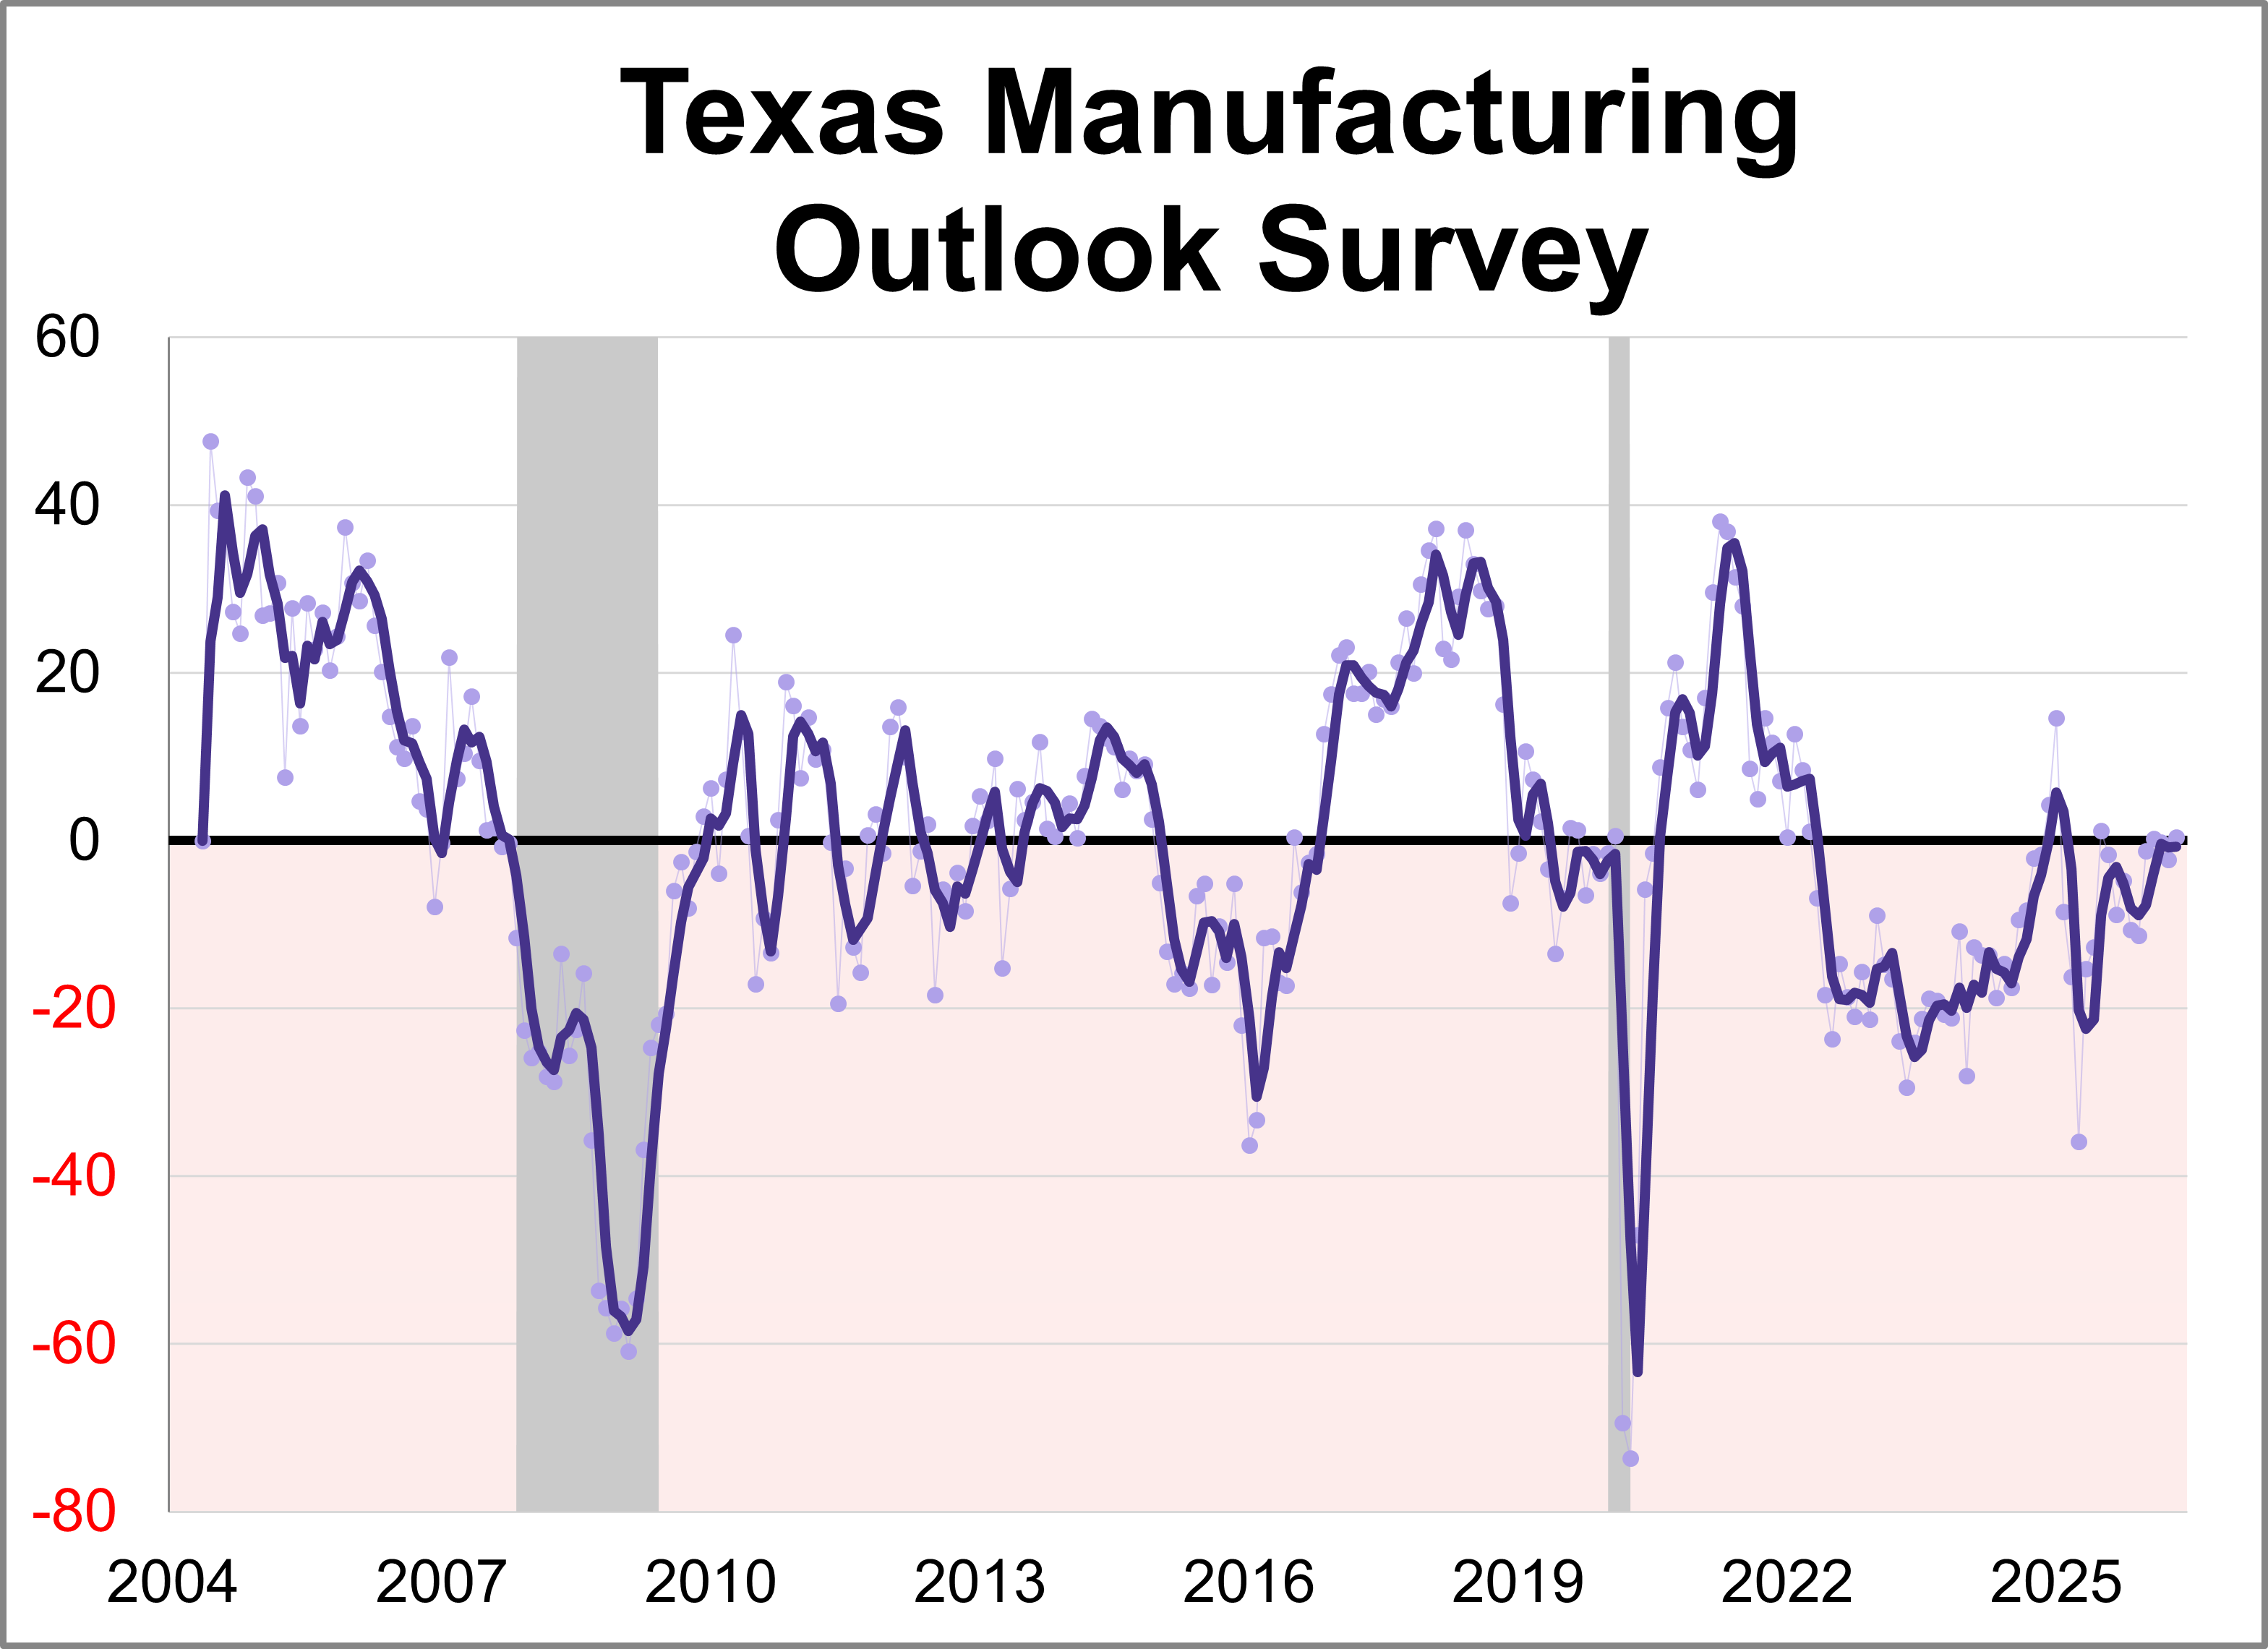
The Dallas Fed released its Texas Manufacturing Outlook Survey (TMOS) for May. The general business activity index rose 2.7 points to 0.4, indicating slower growth of manufacturing activity and stable business conditions perceptions.
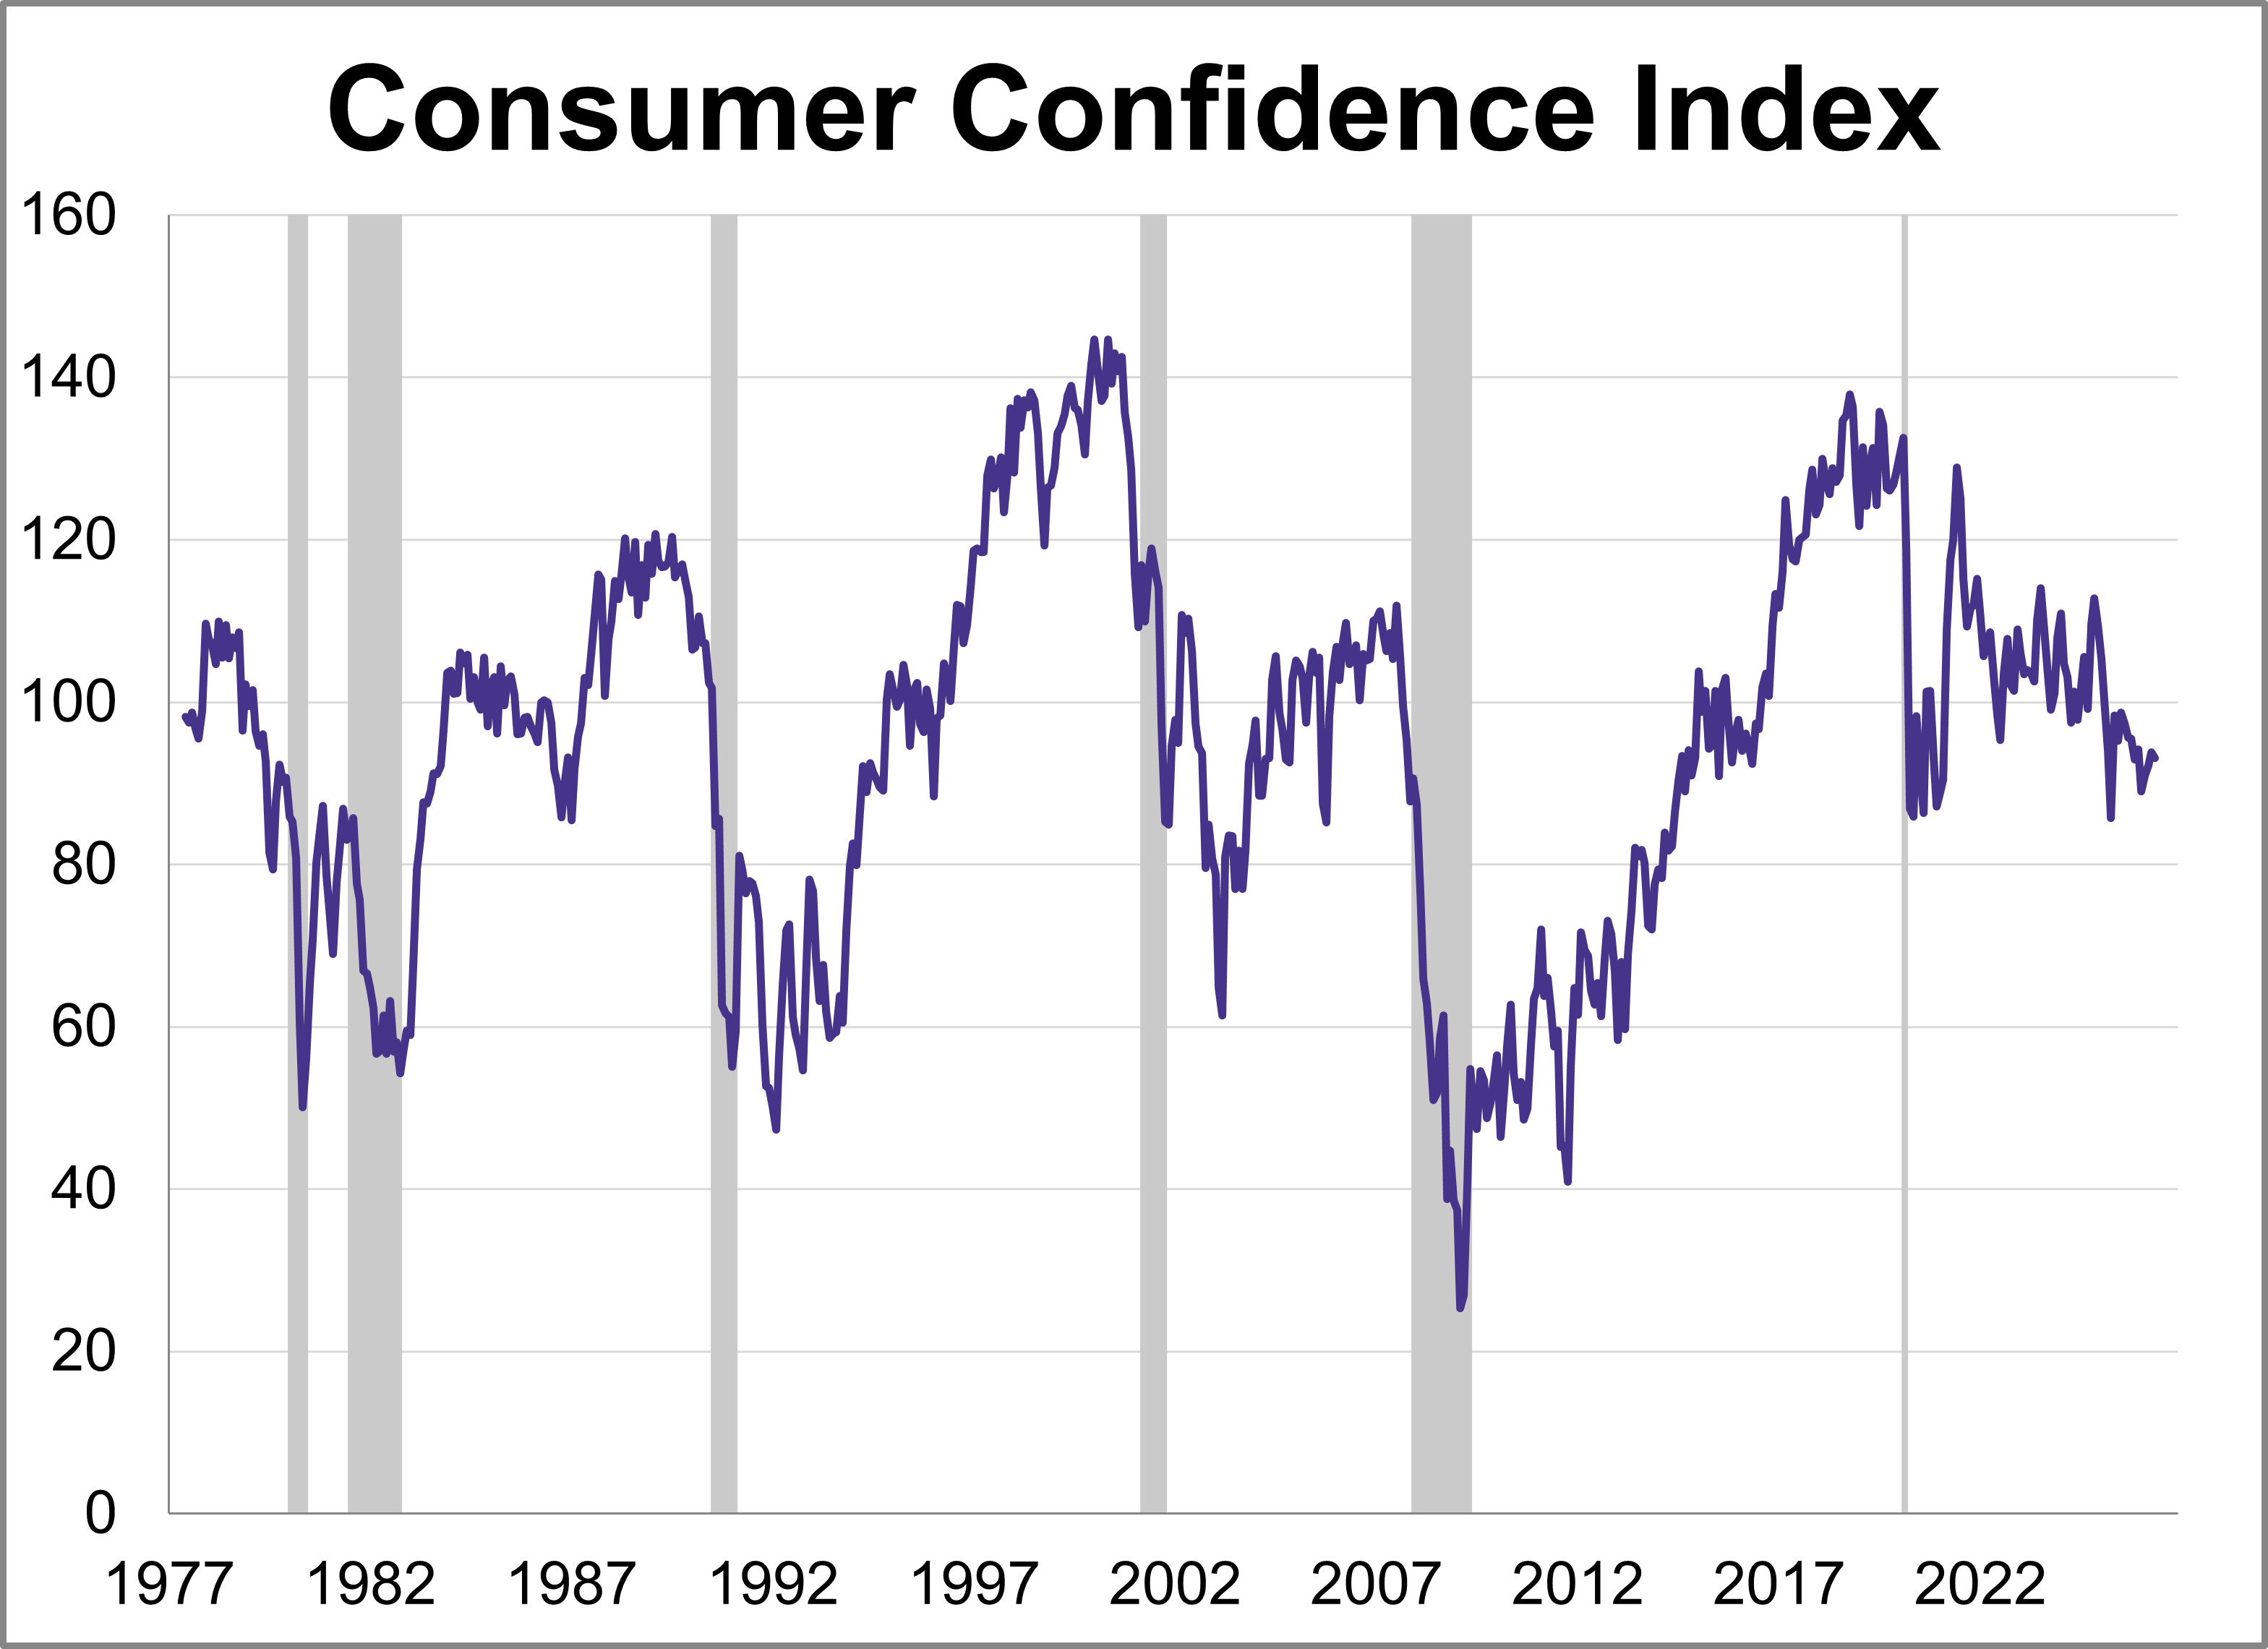
The Conference Board's Consumer Confidence Index® fell for the first time in four months in May, dropping 0.7 points to 93.1. Despite the slight dip, the index came in above the forecast of 91.9.
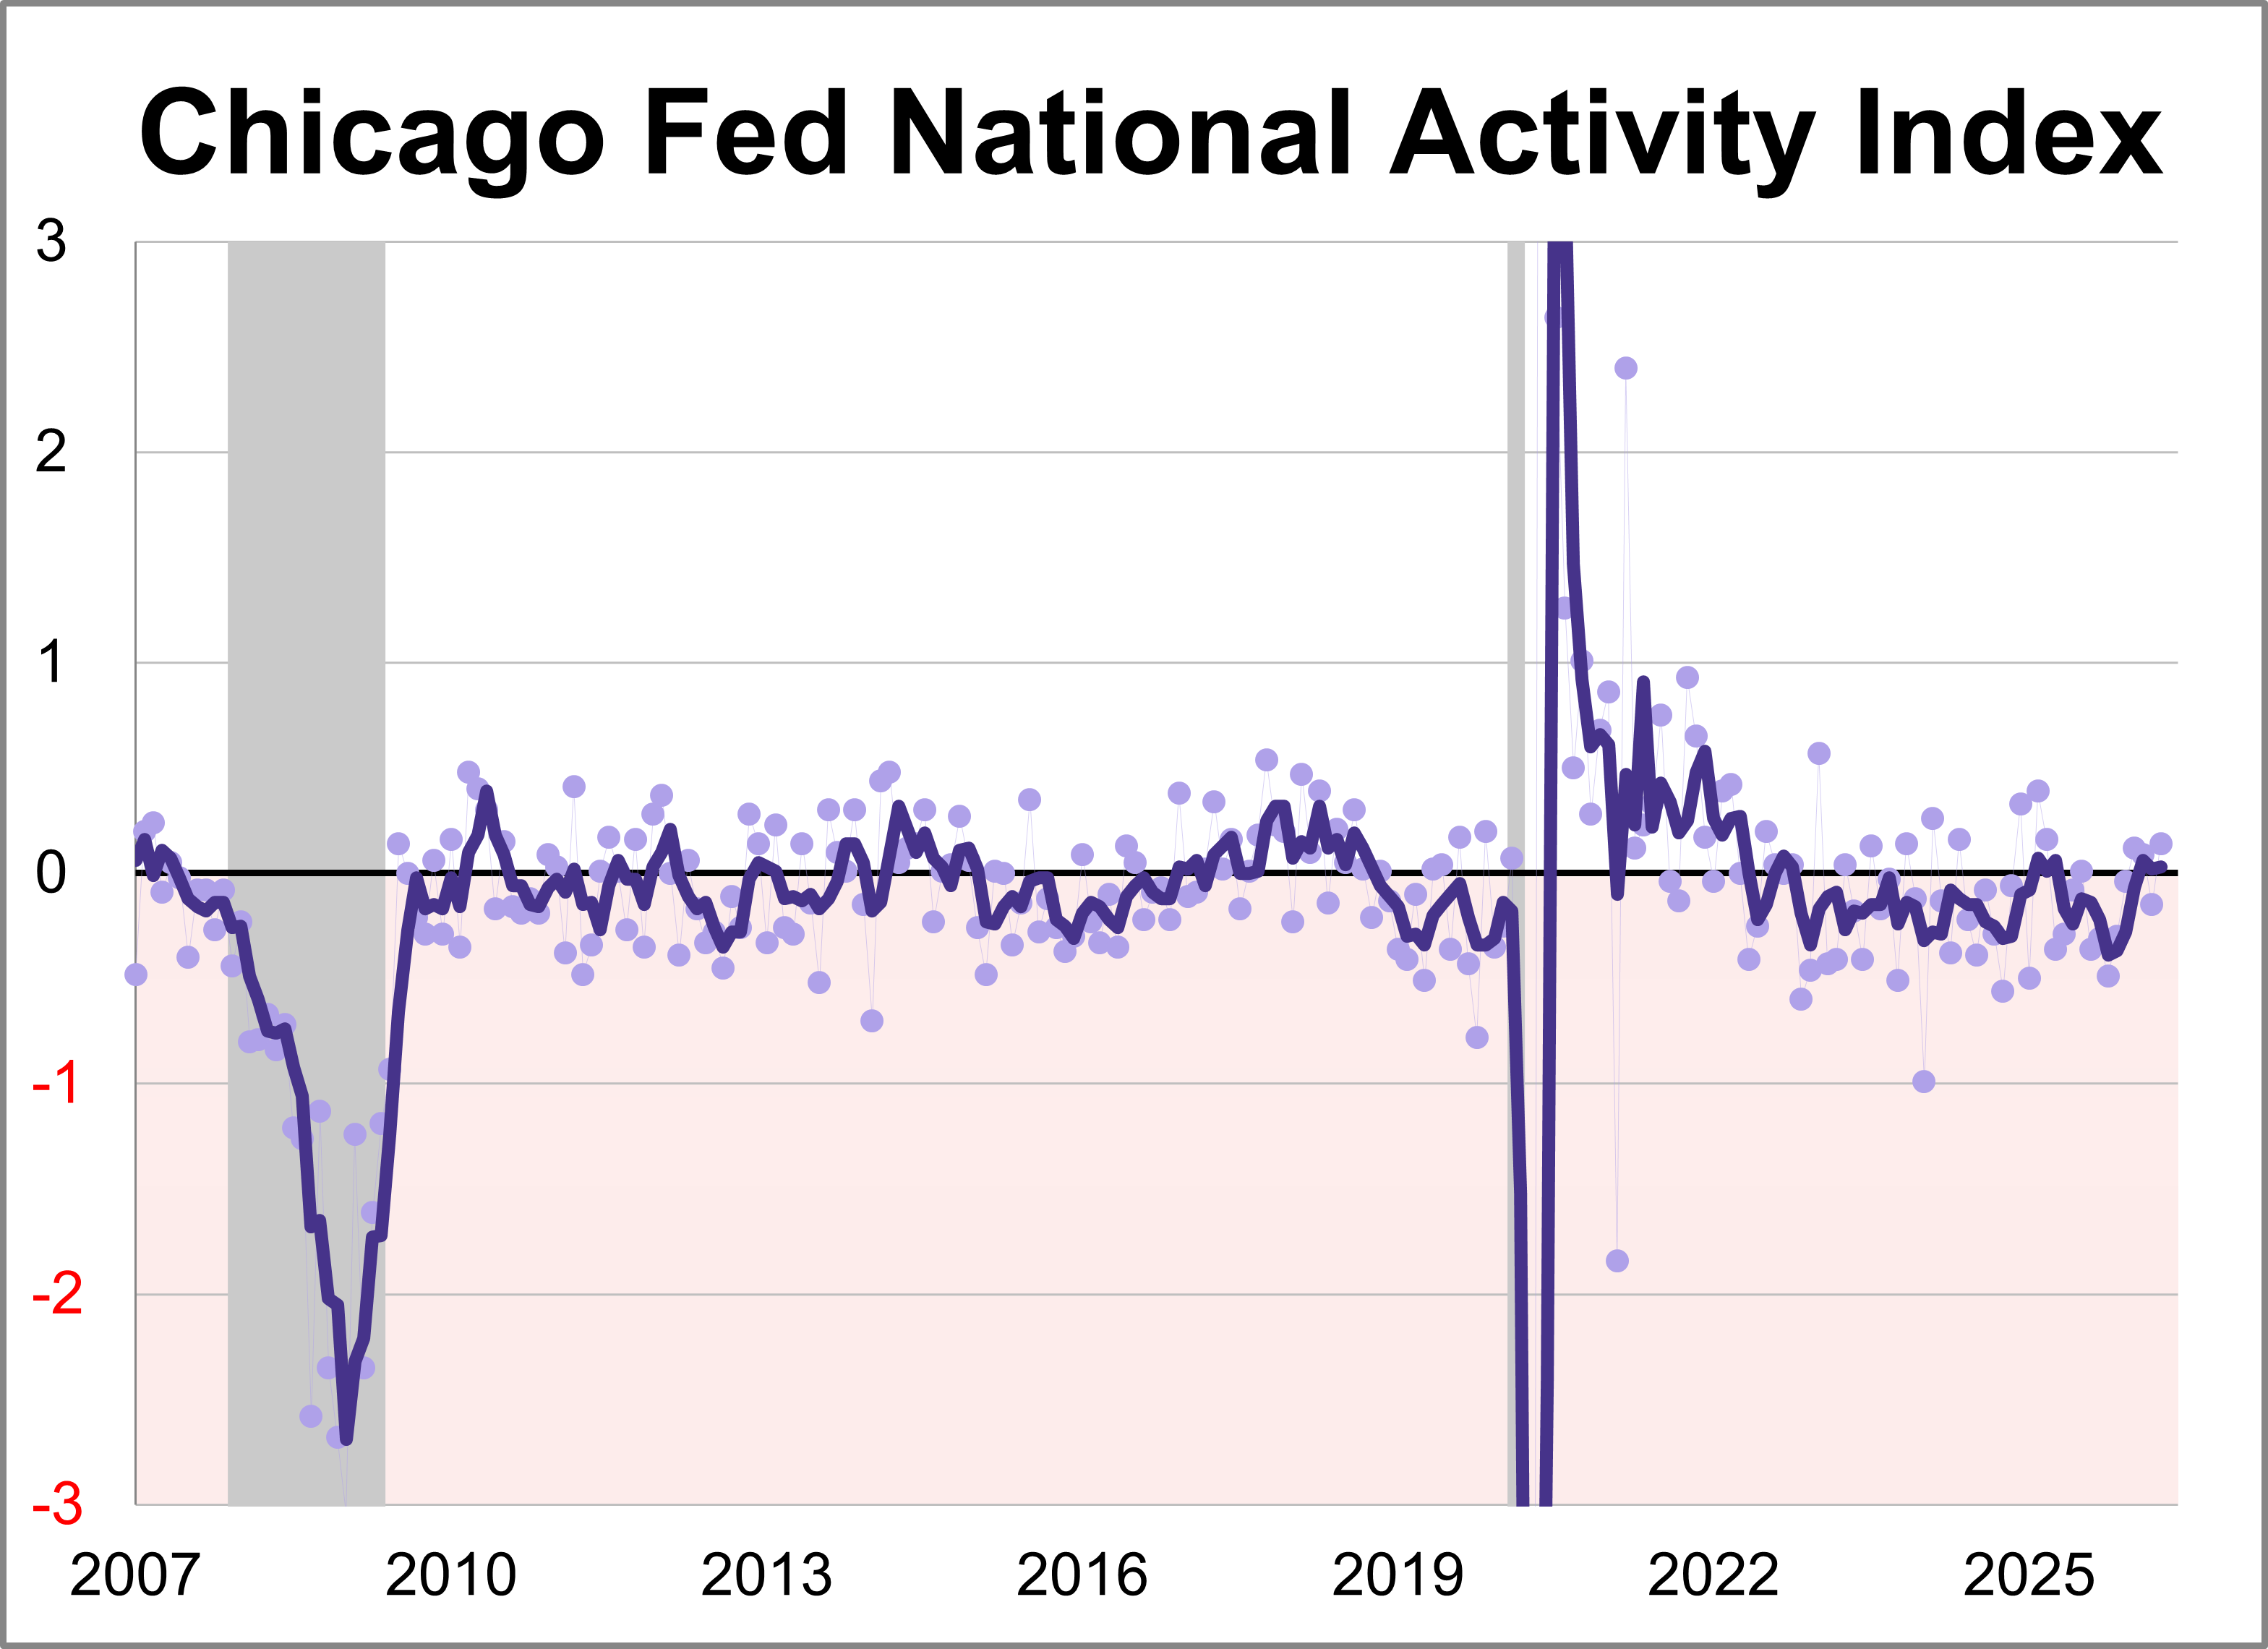
The Chicago Fed National Activity Index (CFNAI) rose to +0.14 in April from -0.15 in March. Two of the four broad categories of indicators used to construct the index increased from March, and two categories made positive contributions.
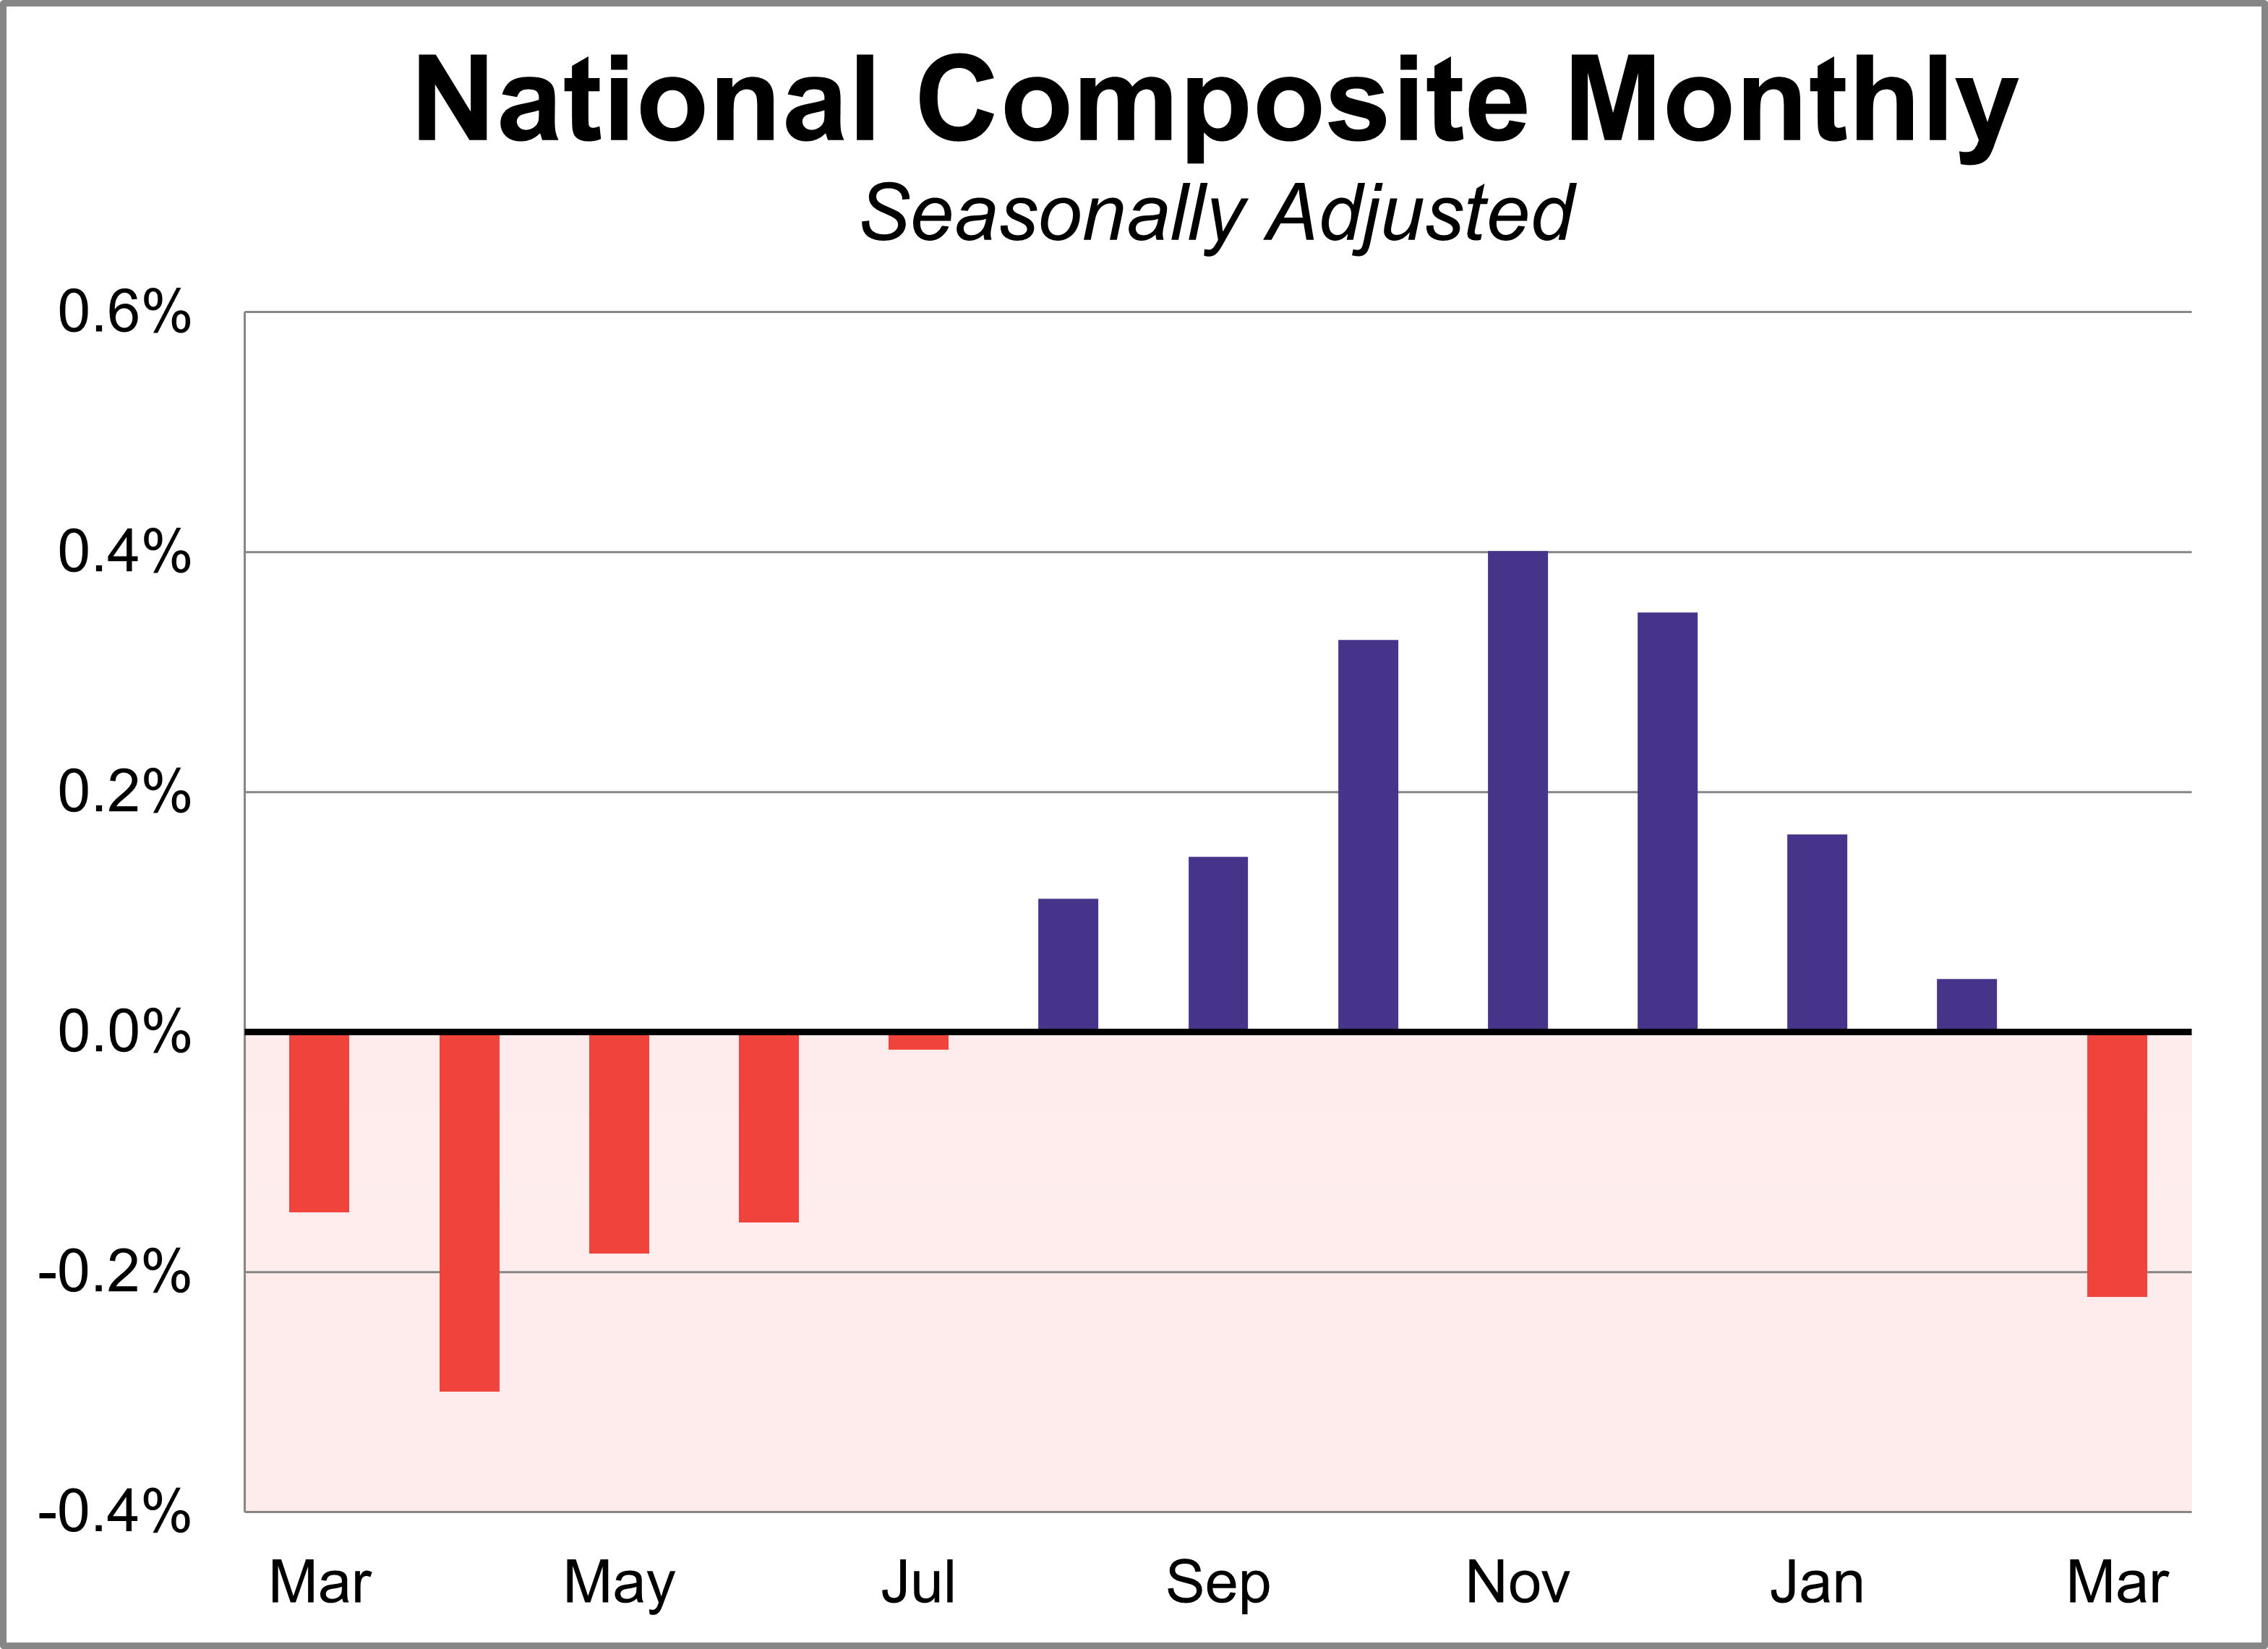
Home prices fell for the first time in eight months in March according to the S&P Cotality Case-Shiller index, as the housing slowdown intensifies. On a seasonally adjusted basis, the national index dropped 0.2% month-over-month and was up 0.7% year-over-year, the slowest pace since June 2023.
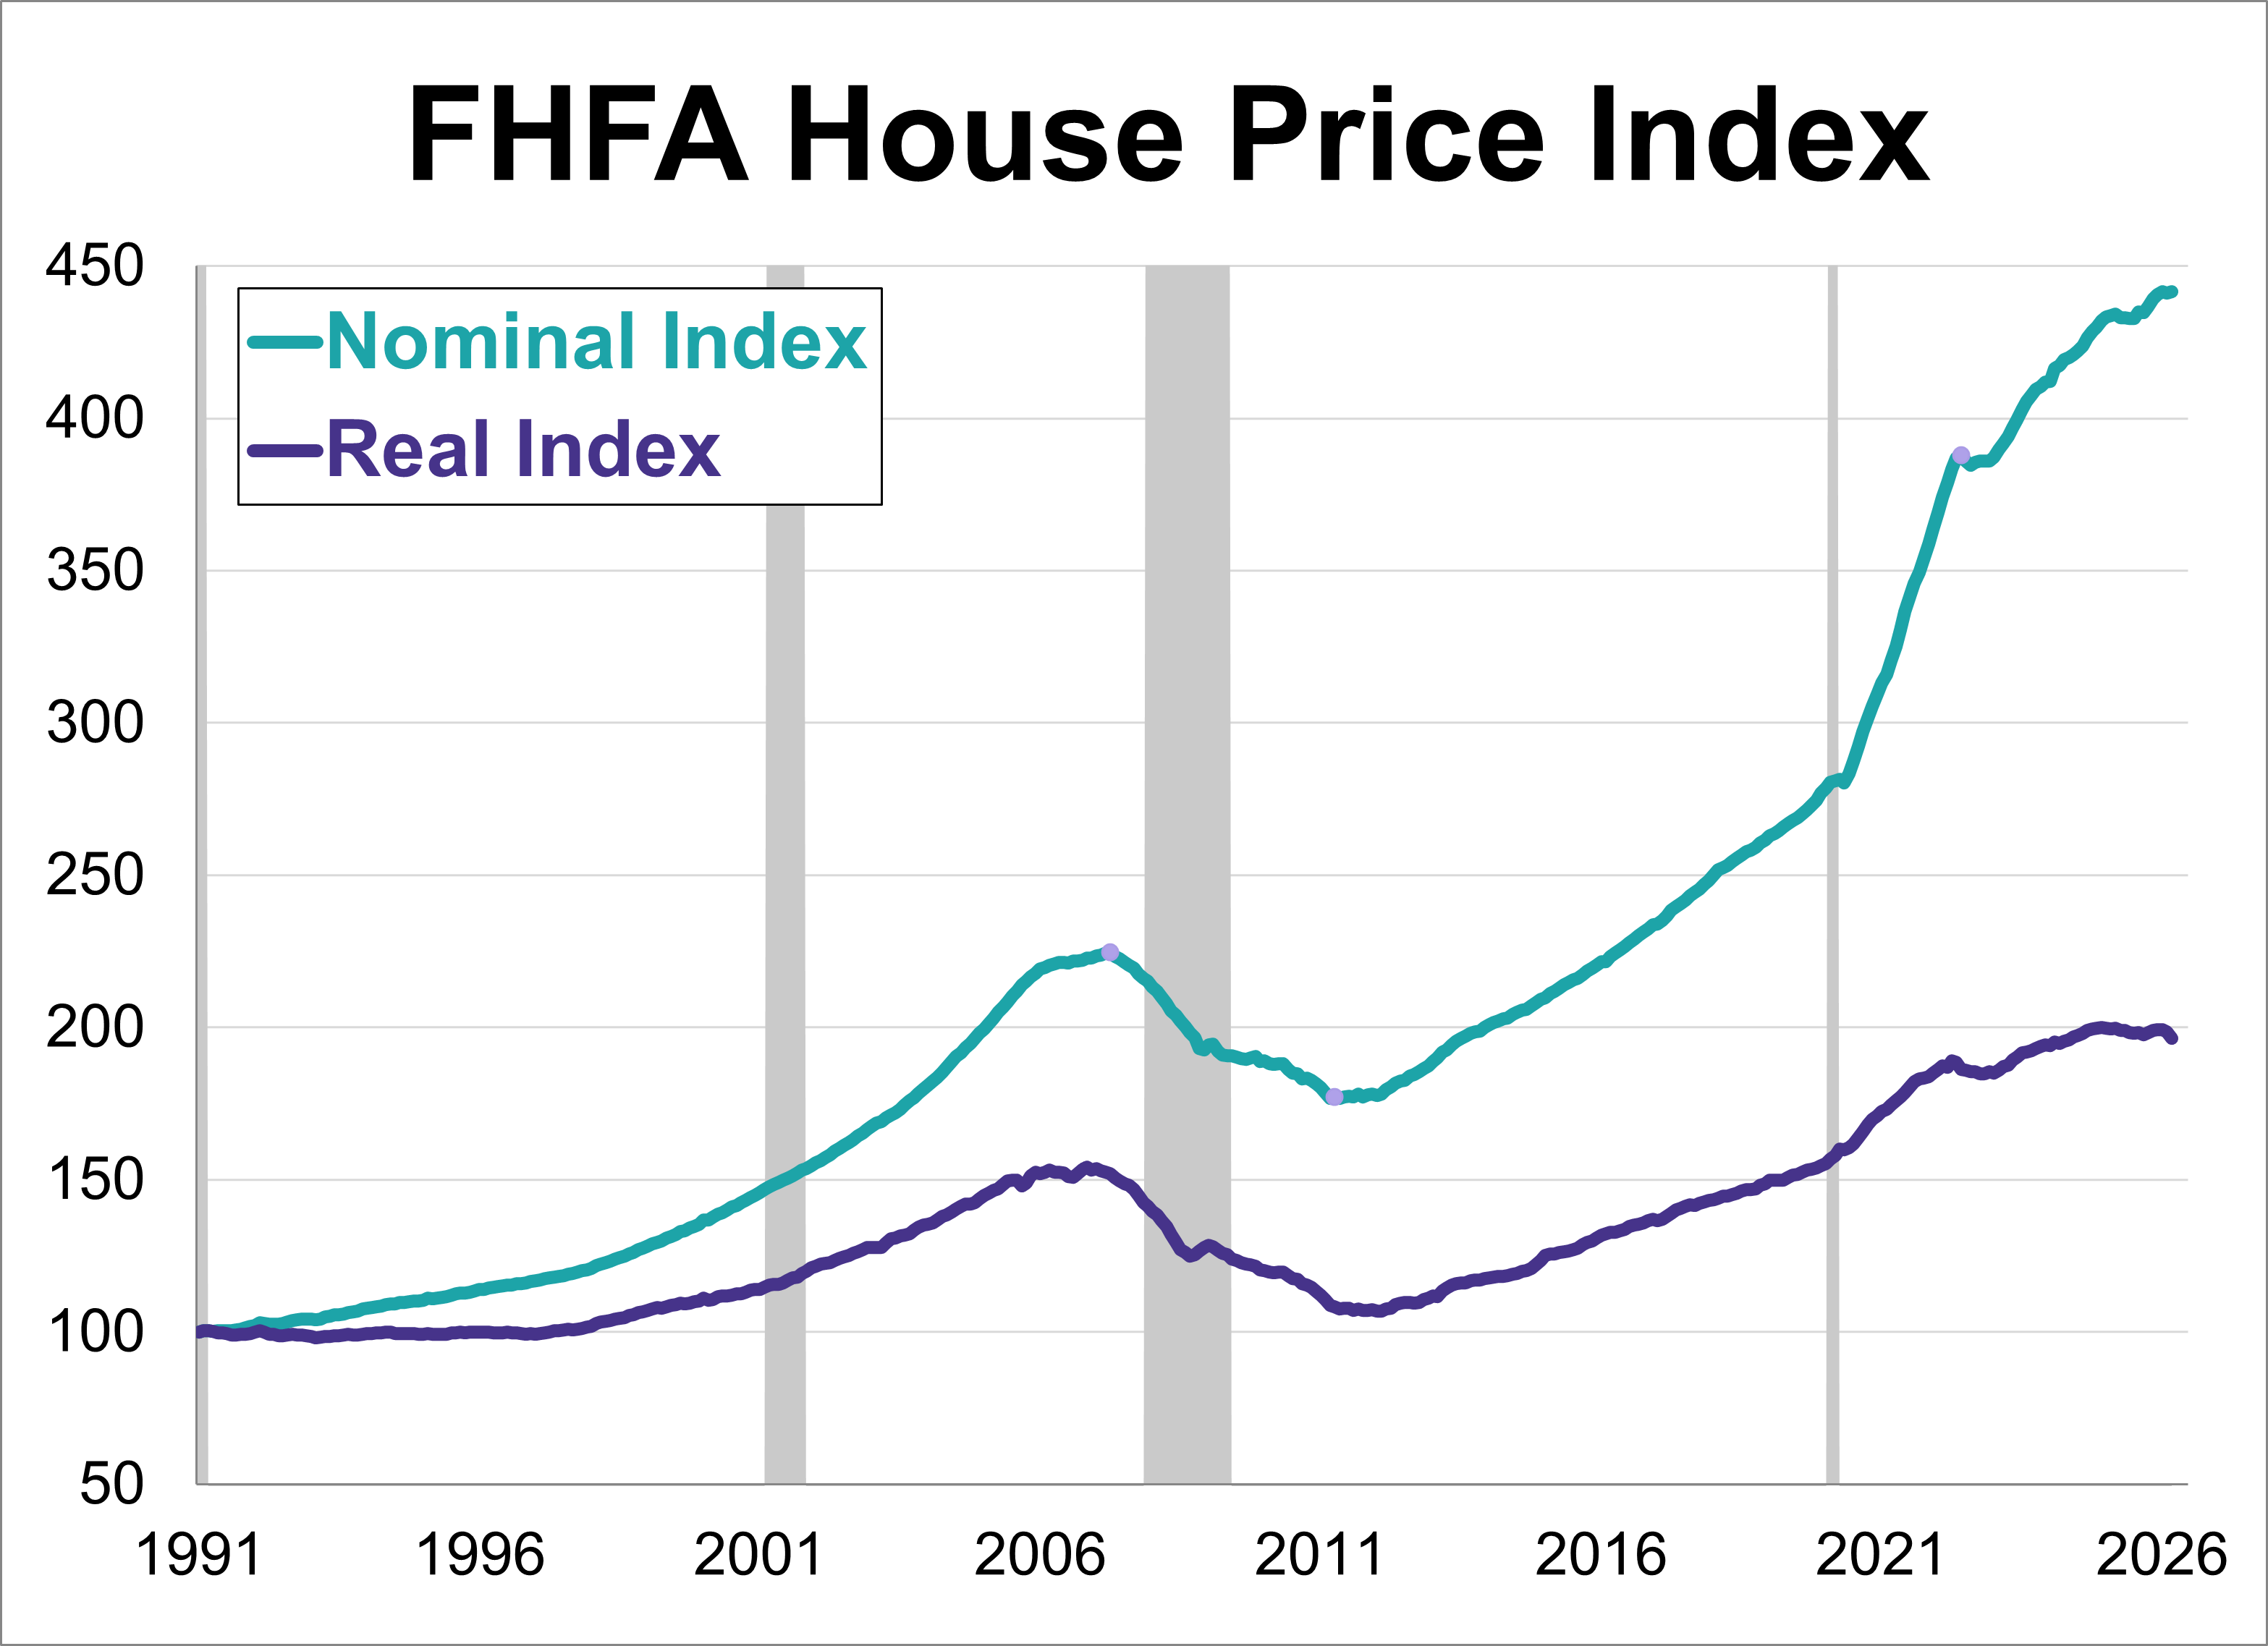
The Federal Housing Finance Agency (FHFA) House Price Index (HPI) reached a new record high in March, rising 0.1% to 441.6.
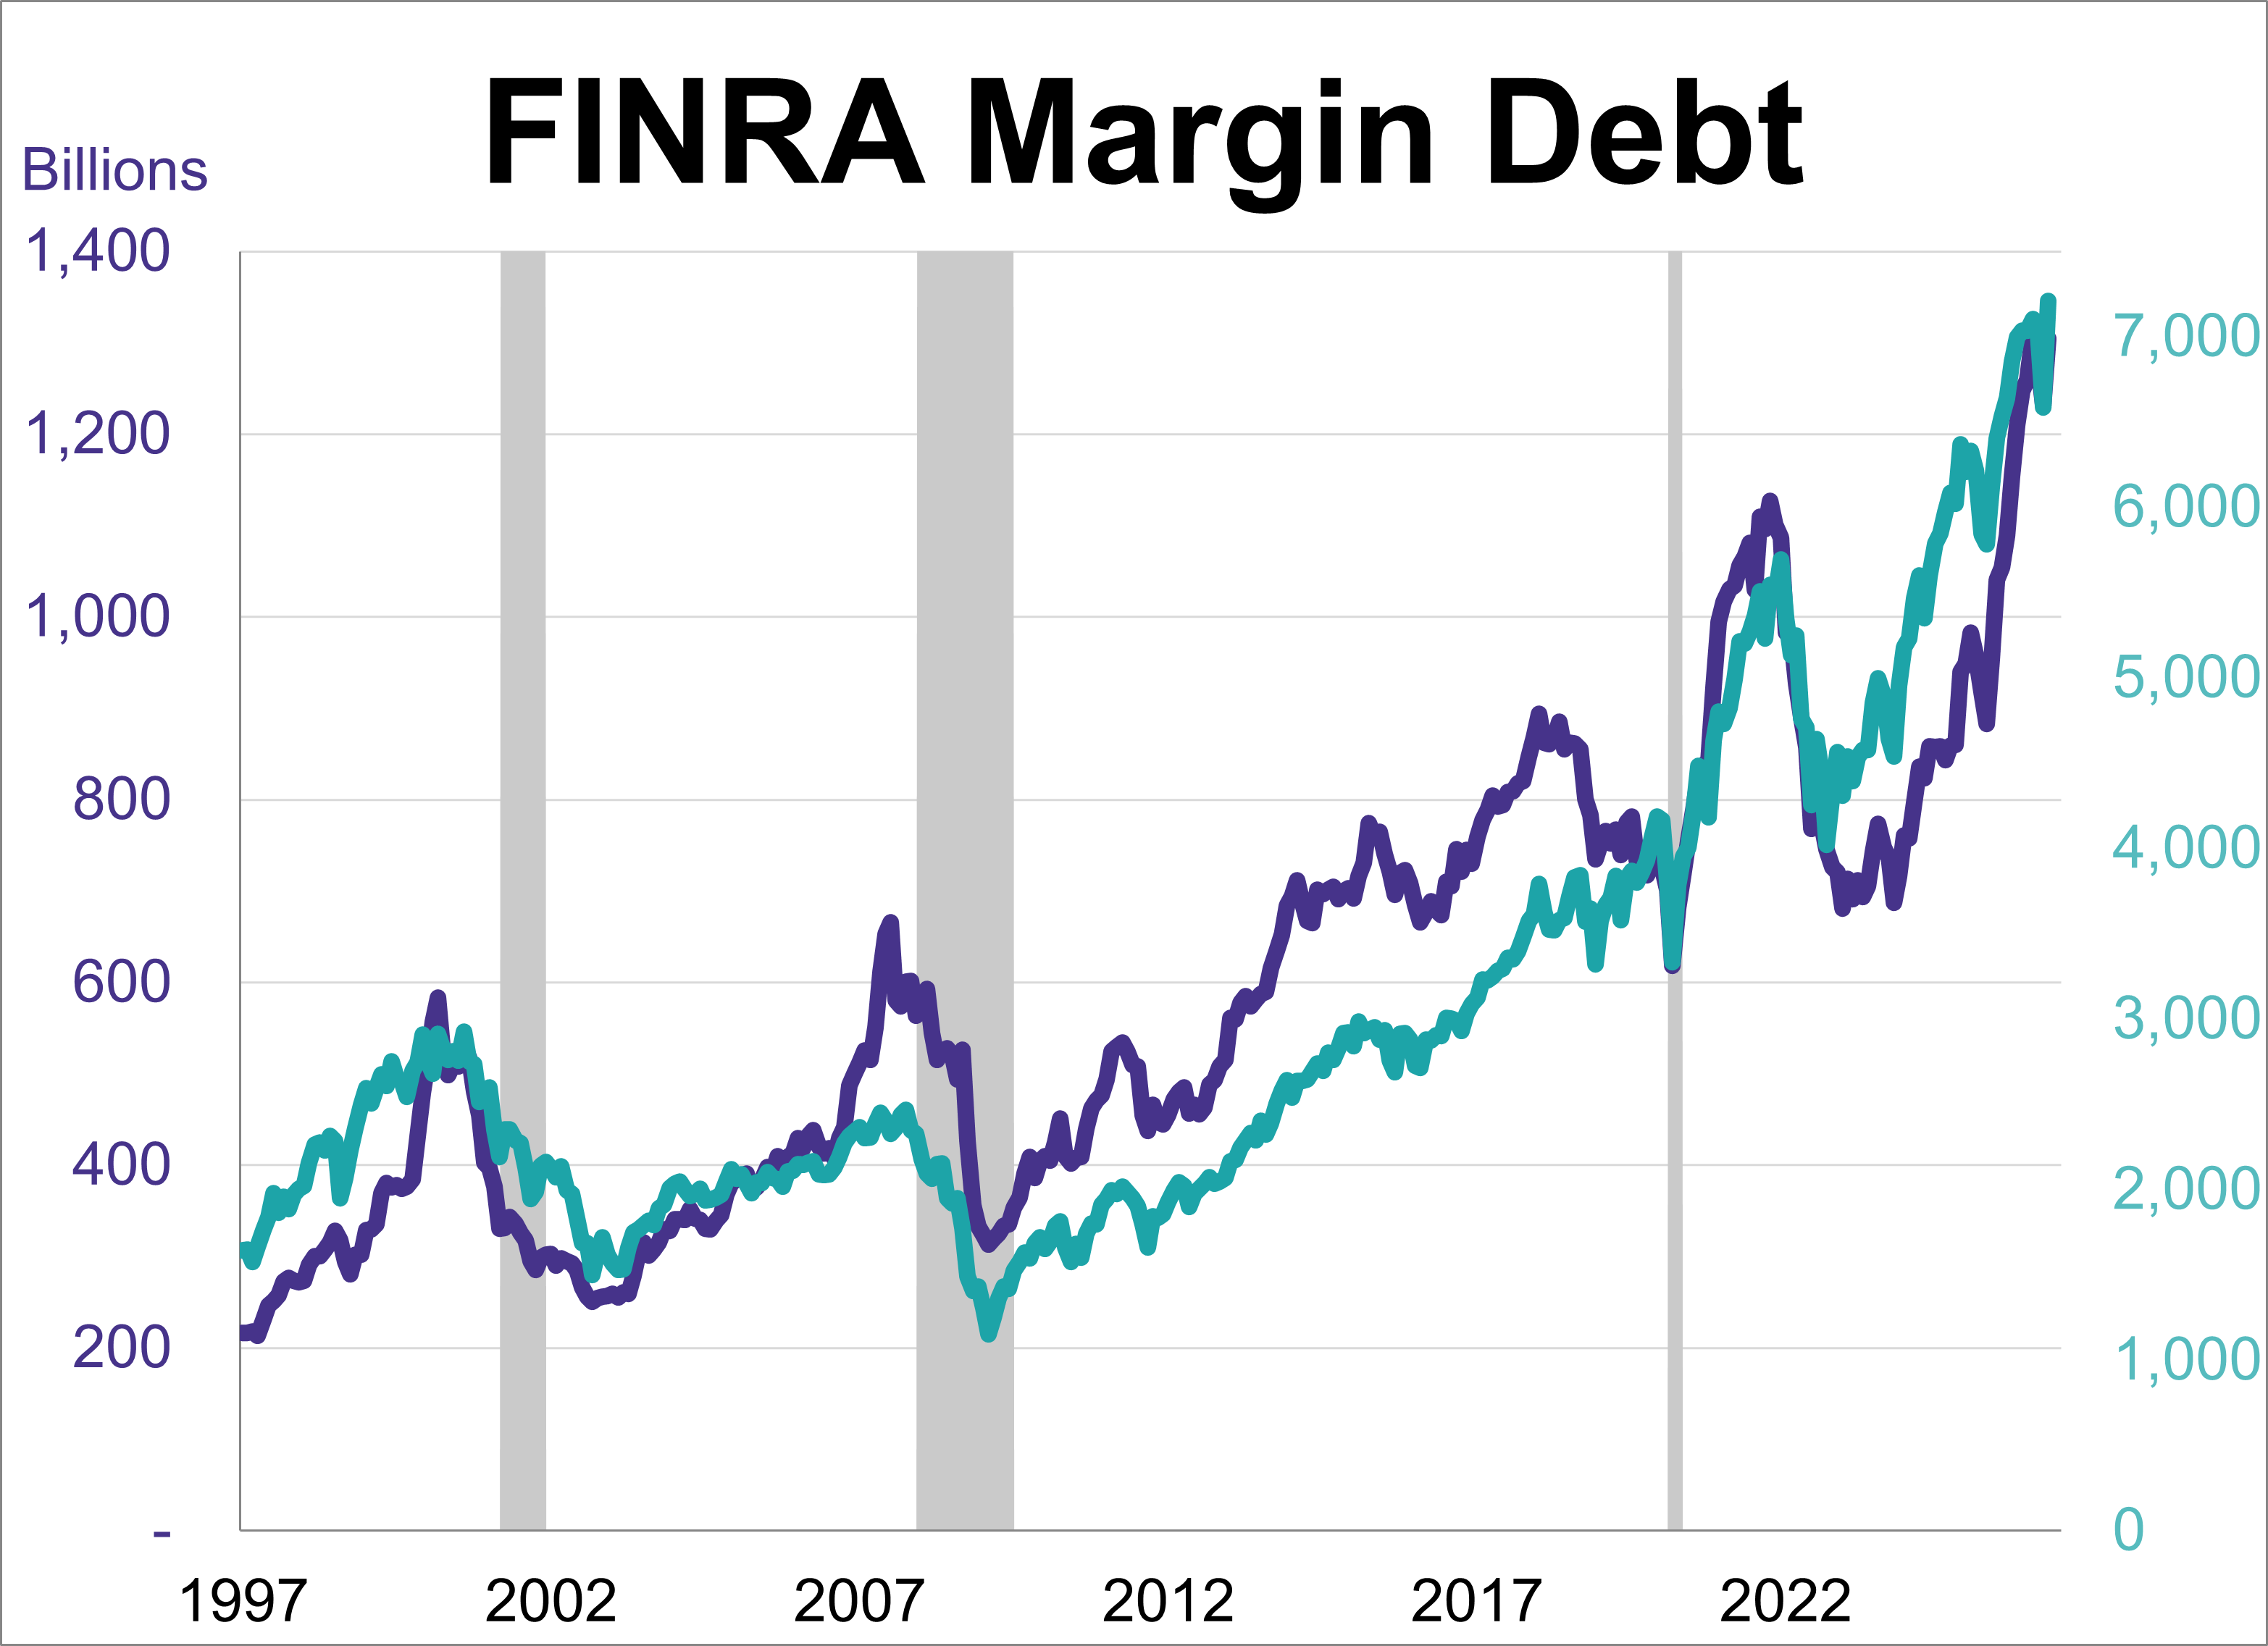
There is currently a stark contrast between everyday consumer confidence and financial market behavior. On one hand, persistent inflation and elevated living costs have driven consumer sentiment to historic lows. On the other hand, financial market participants are exhibiting aggressive risk appetite, with margin debt surging to an all-time high record on the heels of major equity market gains.
Consumer sentiment sank for a third straight month to another record low amid intense cost of living concerns and stubbornly high prices. The final May reading for the University of Michigan Consumer Sentiment Index came in at 44.8, marking a 5-point drop from April and falling well below the month's preliminary estimate of 48.2.
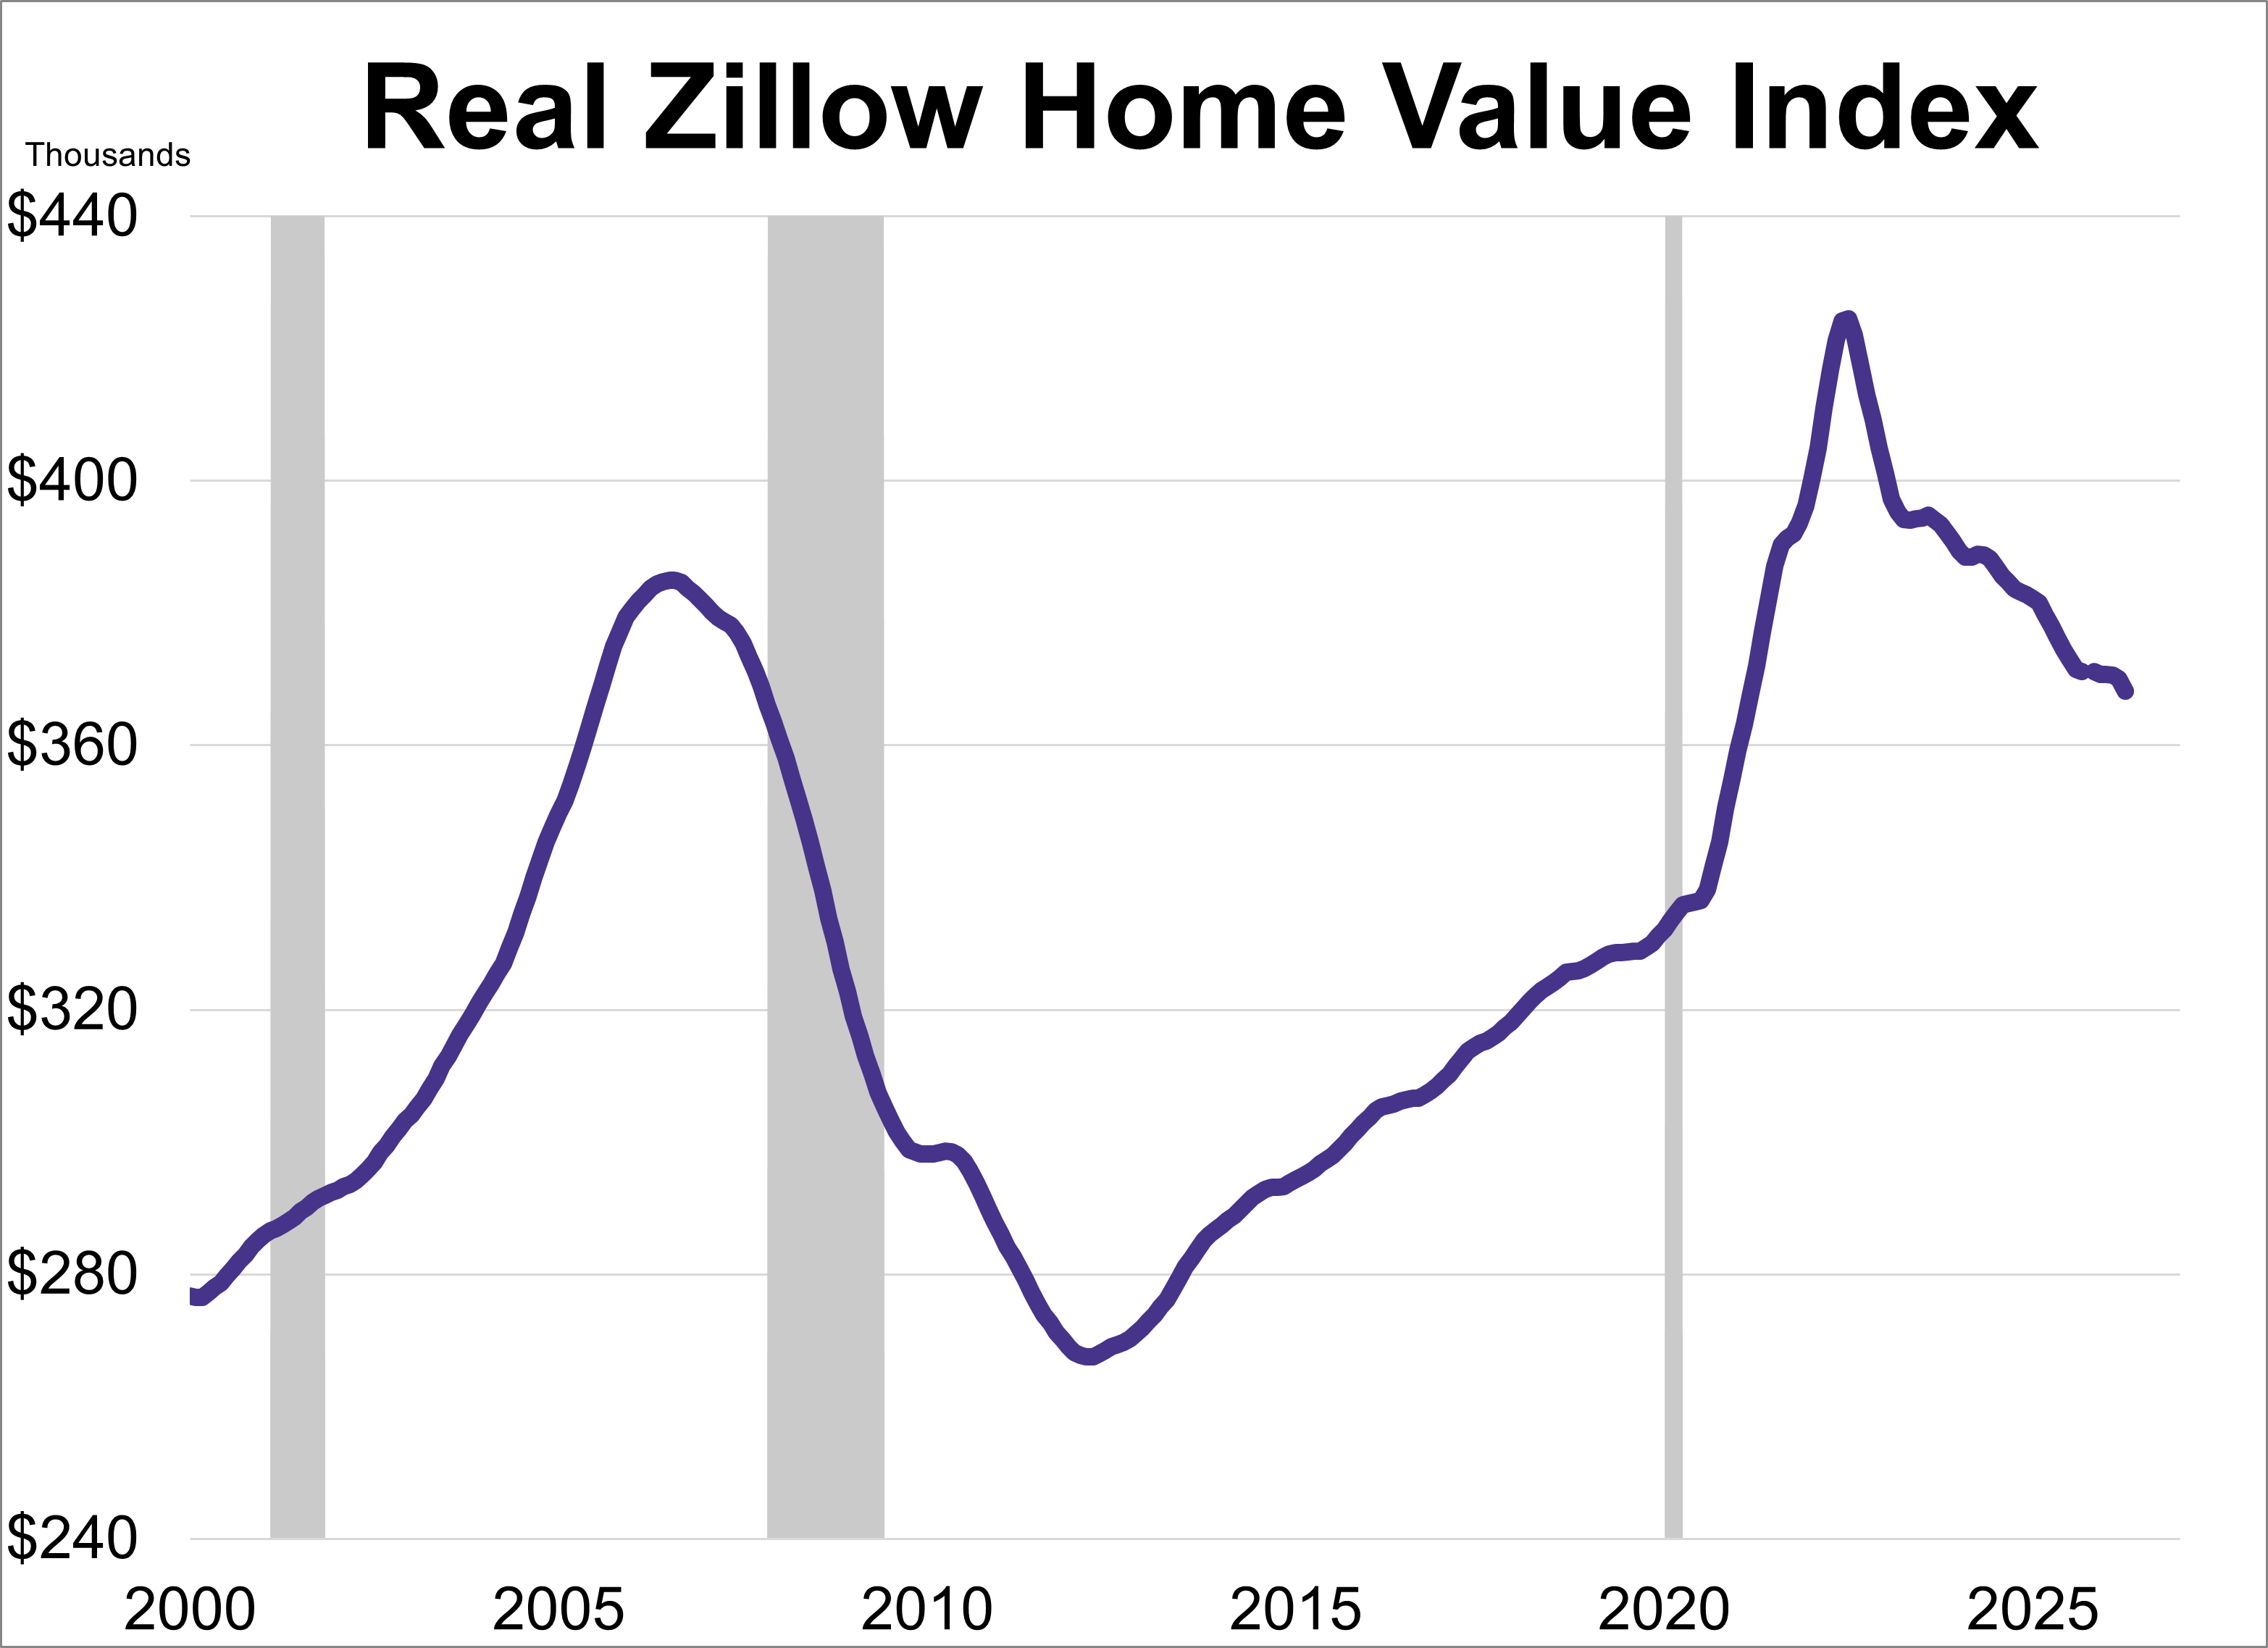
Home values continued their upward trend in April, according to the Zillow Home Value Index. However, after adjusting for inflation, real home values dropped sharply, remaining at their lowest level in over five years.
The Kansas City Fed Manufacturing Survey revealed regional activity continued to increase in May. The composite index came in at 8 this month, down slightly from 10 in April but still indicating continued expansion.
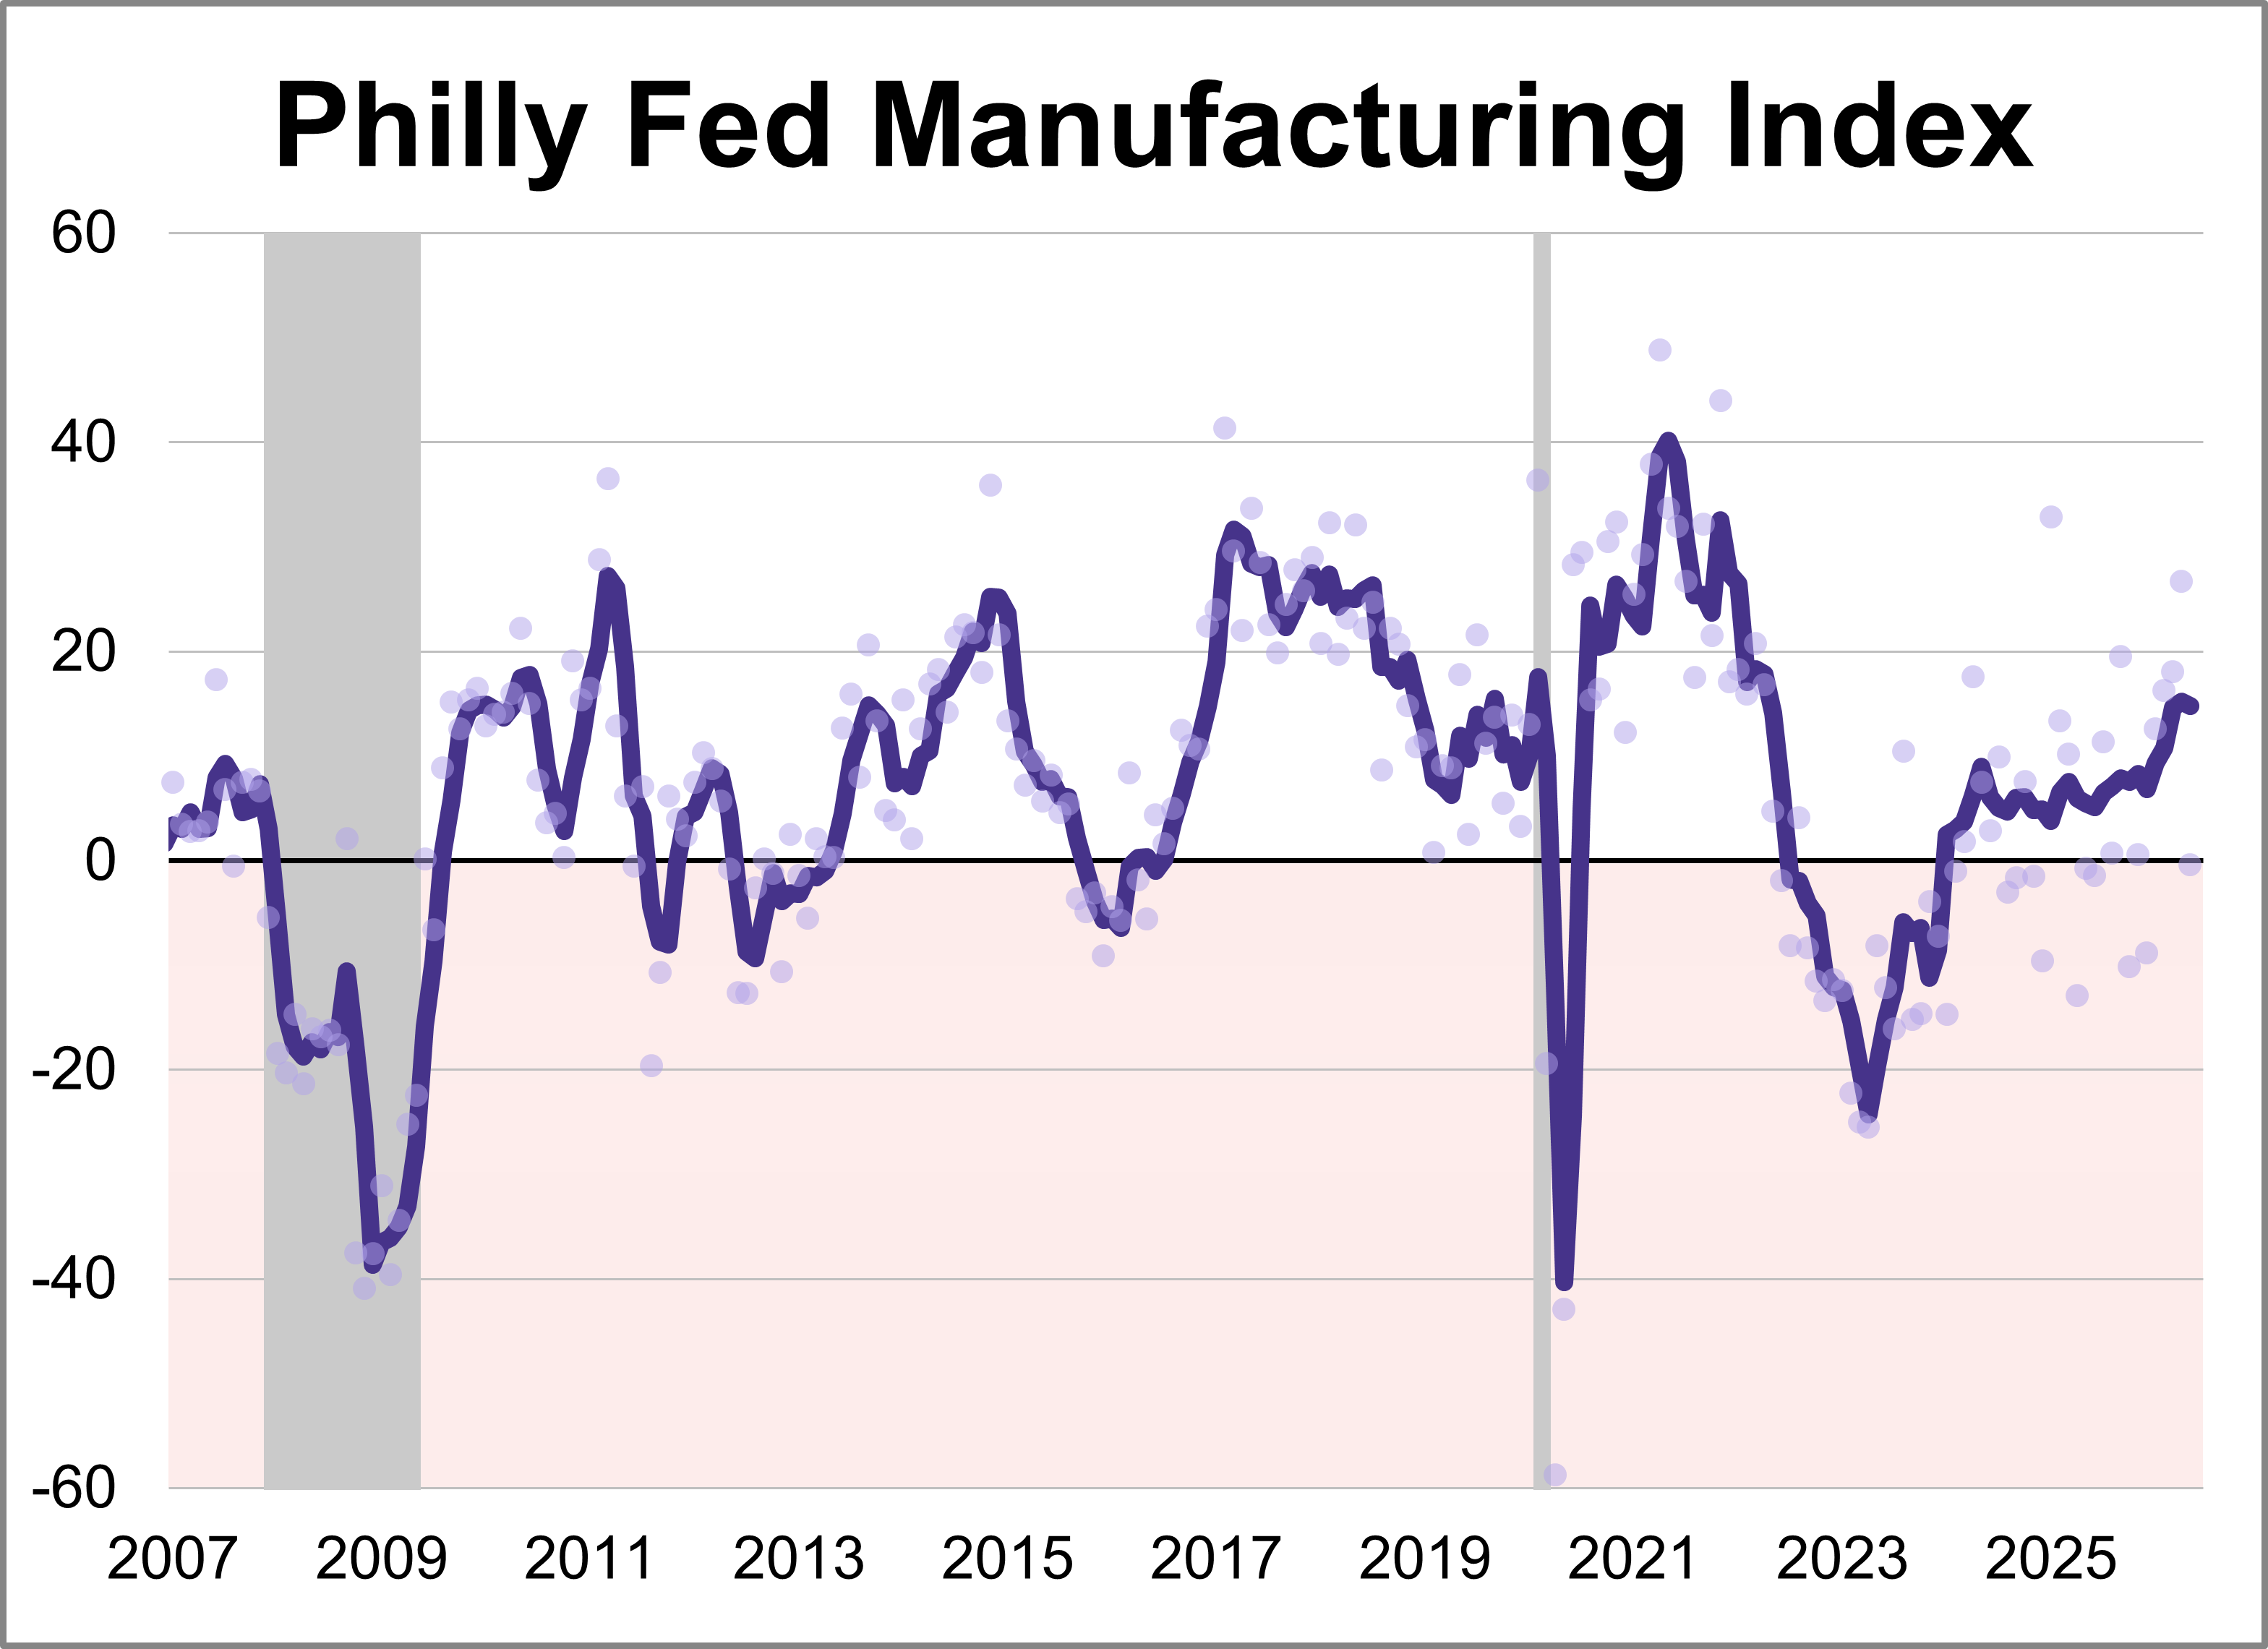
The latest Philadelphia Fed manufacturing index showed activity weakened in May, with the index sinking 27.1 points to -0.4. The latest reading marked the lowest level for the index this year and was worse than the forecast of 17.6.
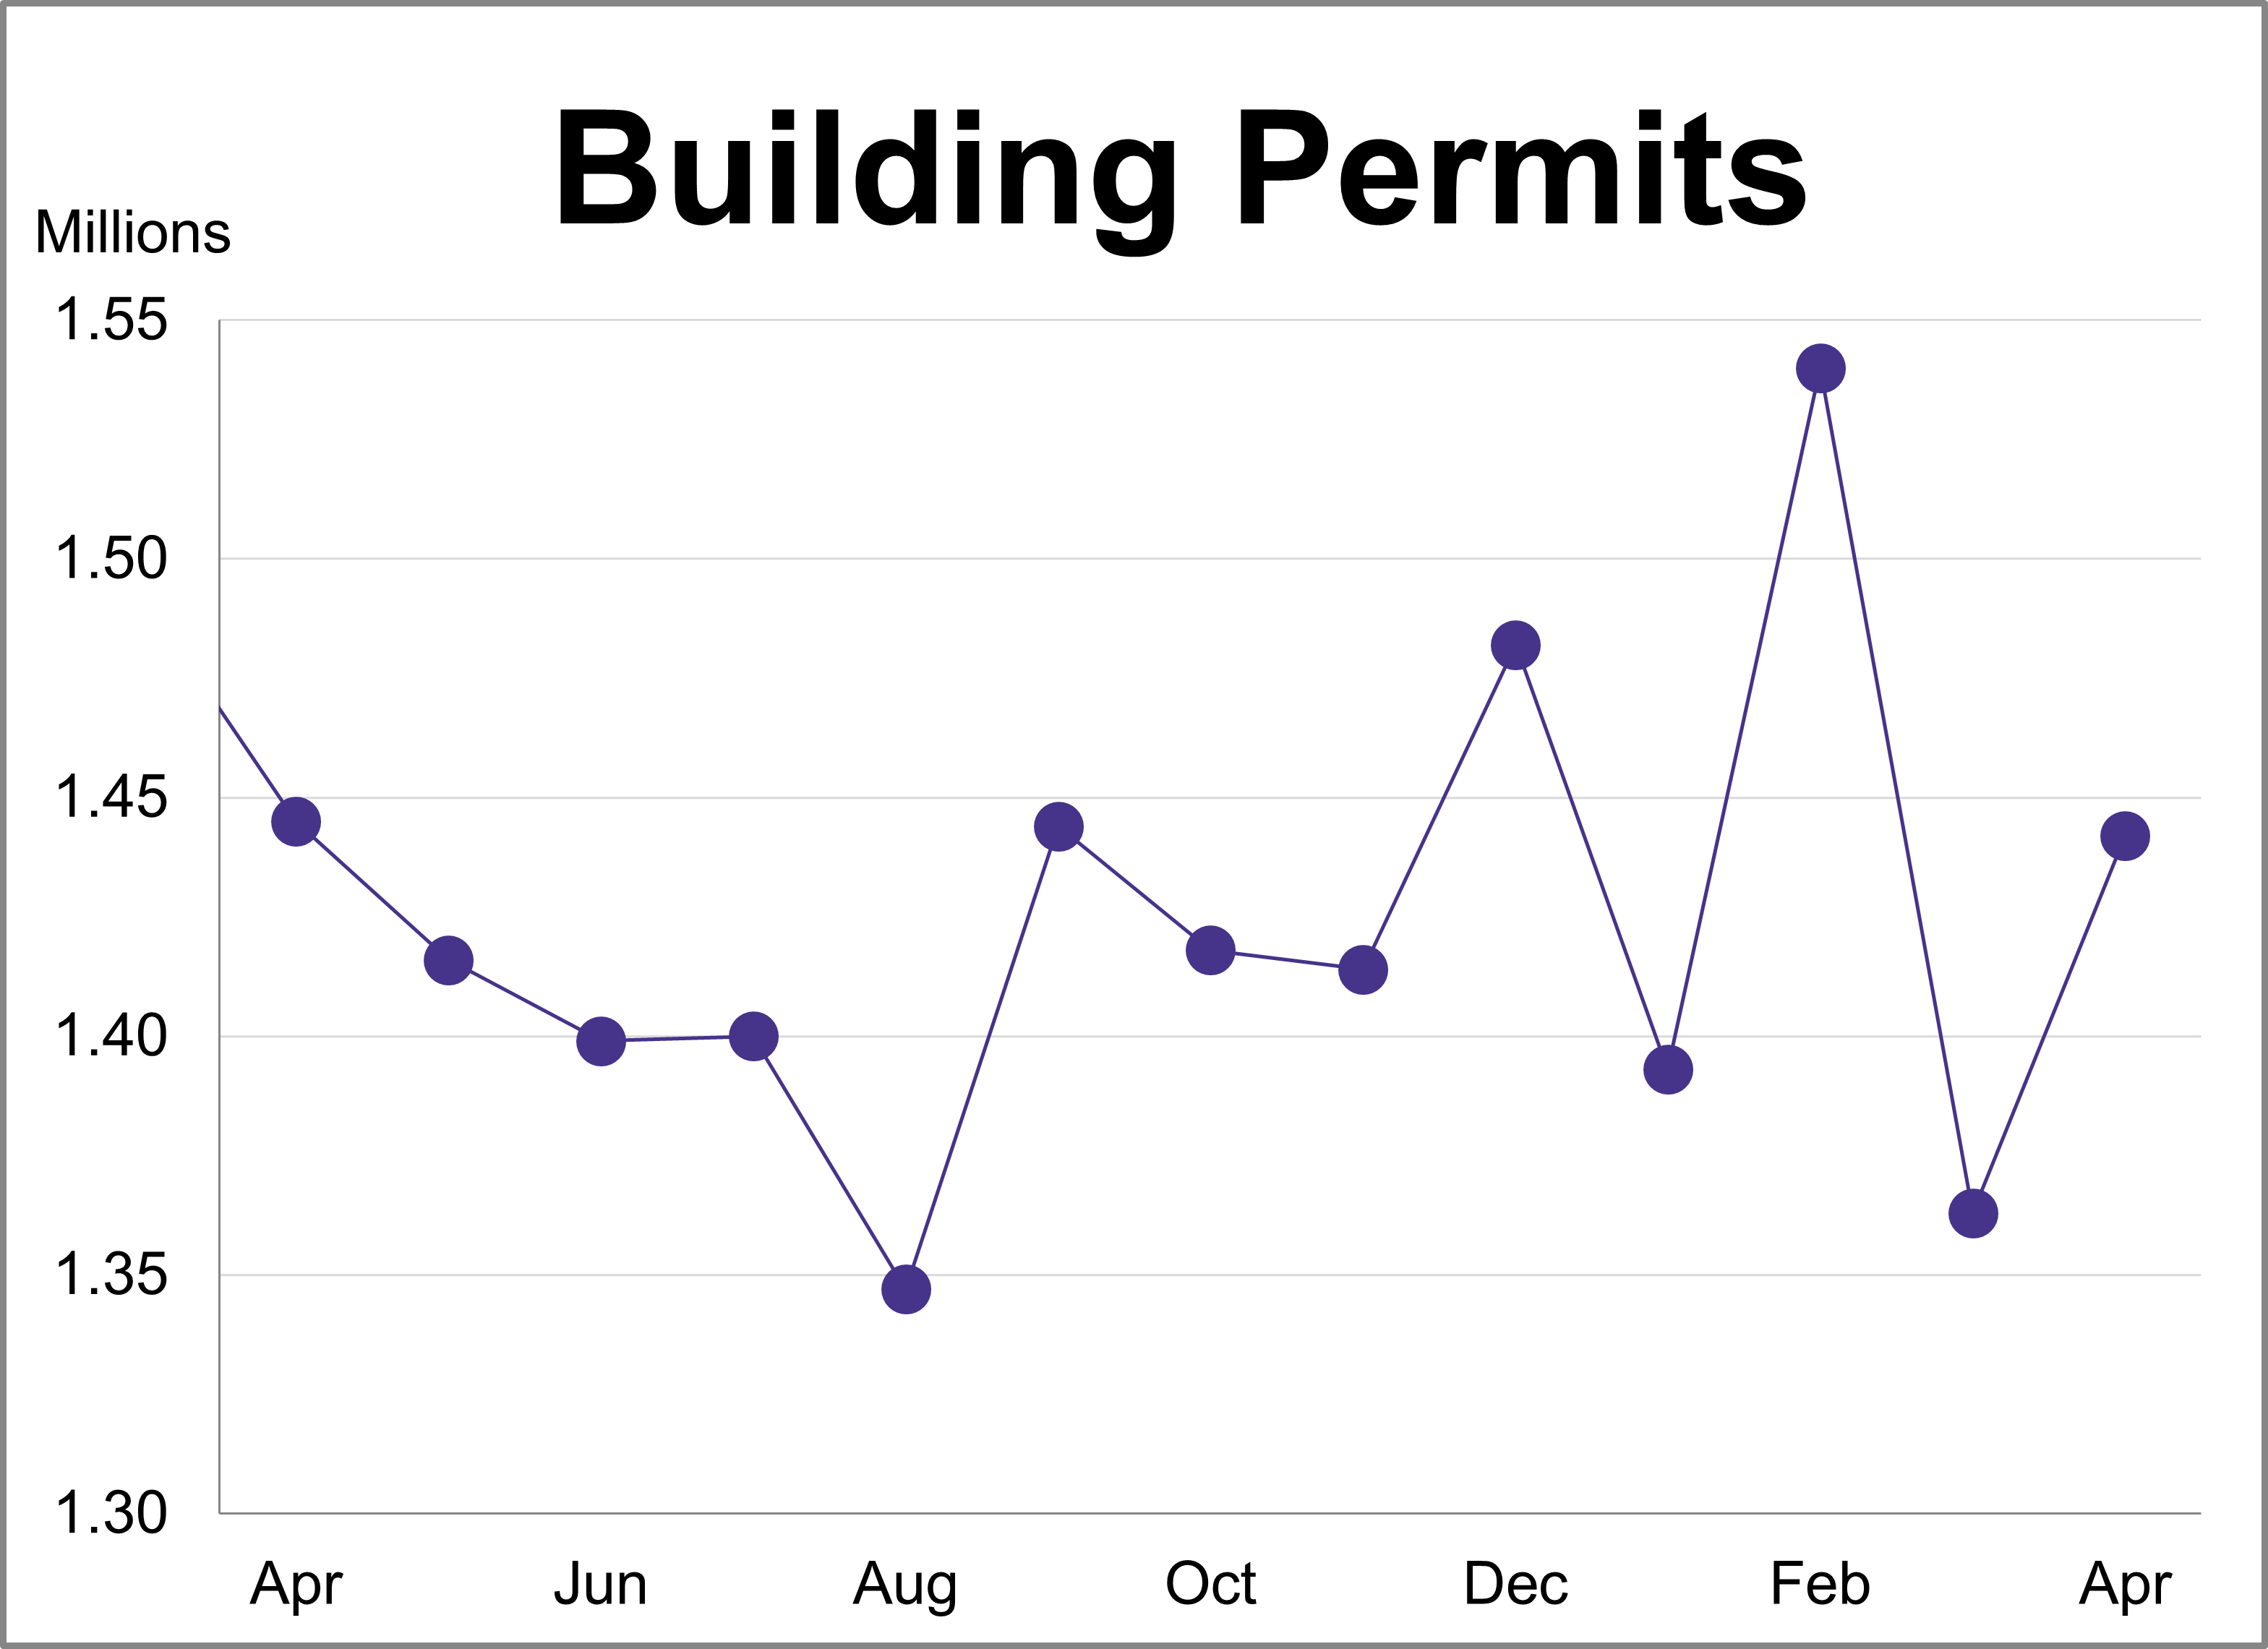
Building permits rose 5.8% to a seasonally adjusted annual rate of 1.442 million. The latest reading exceeded the forecast of 1.380 million.
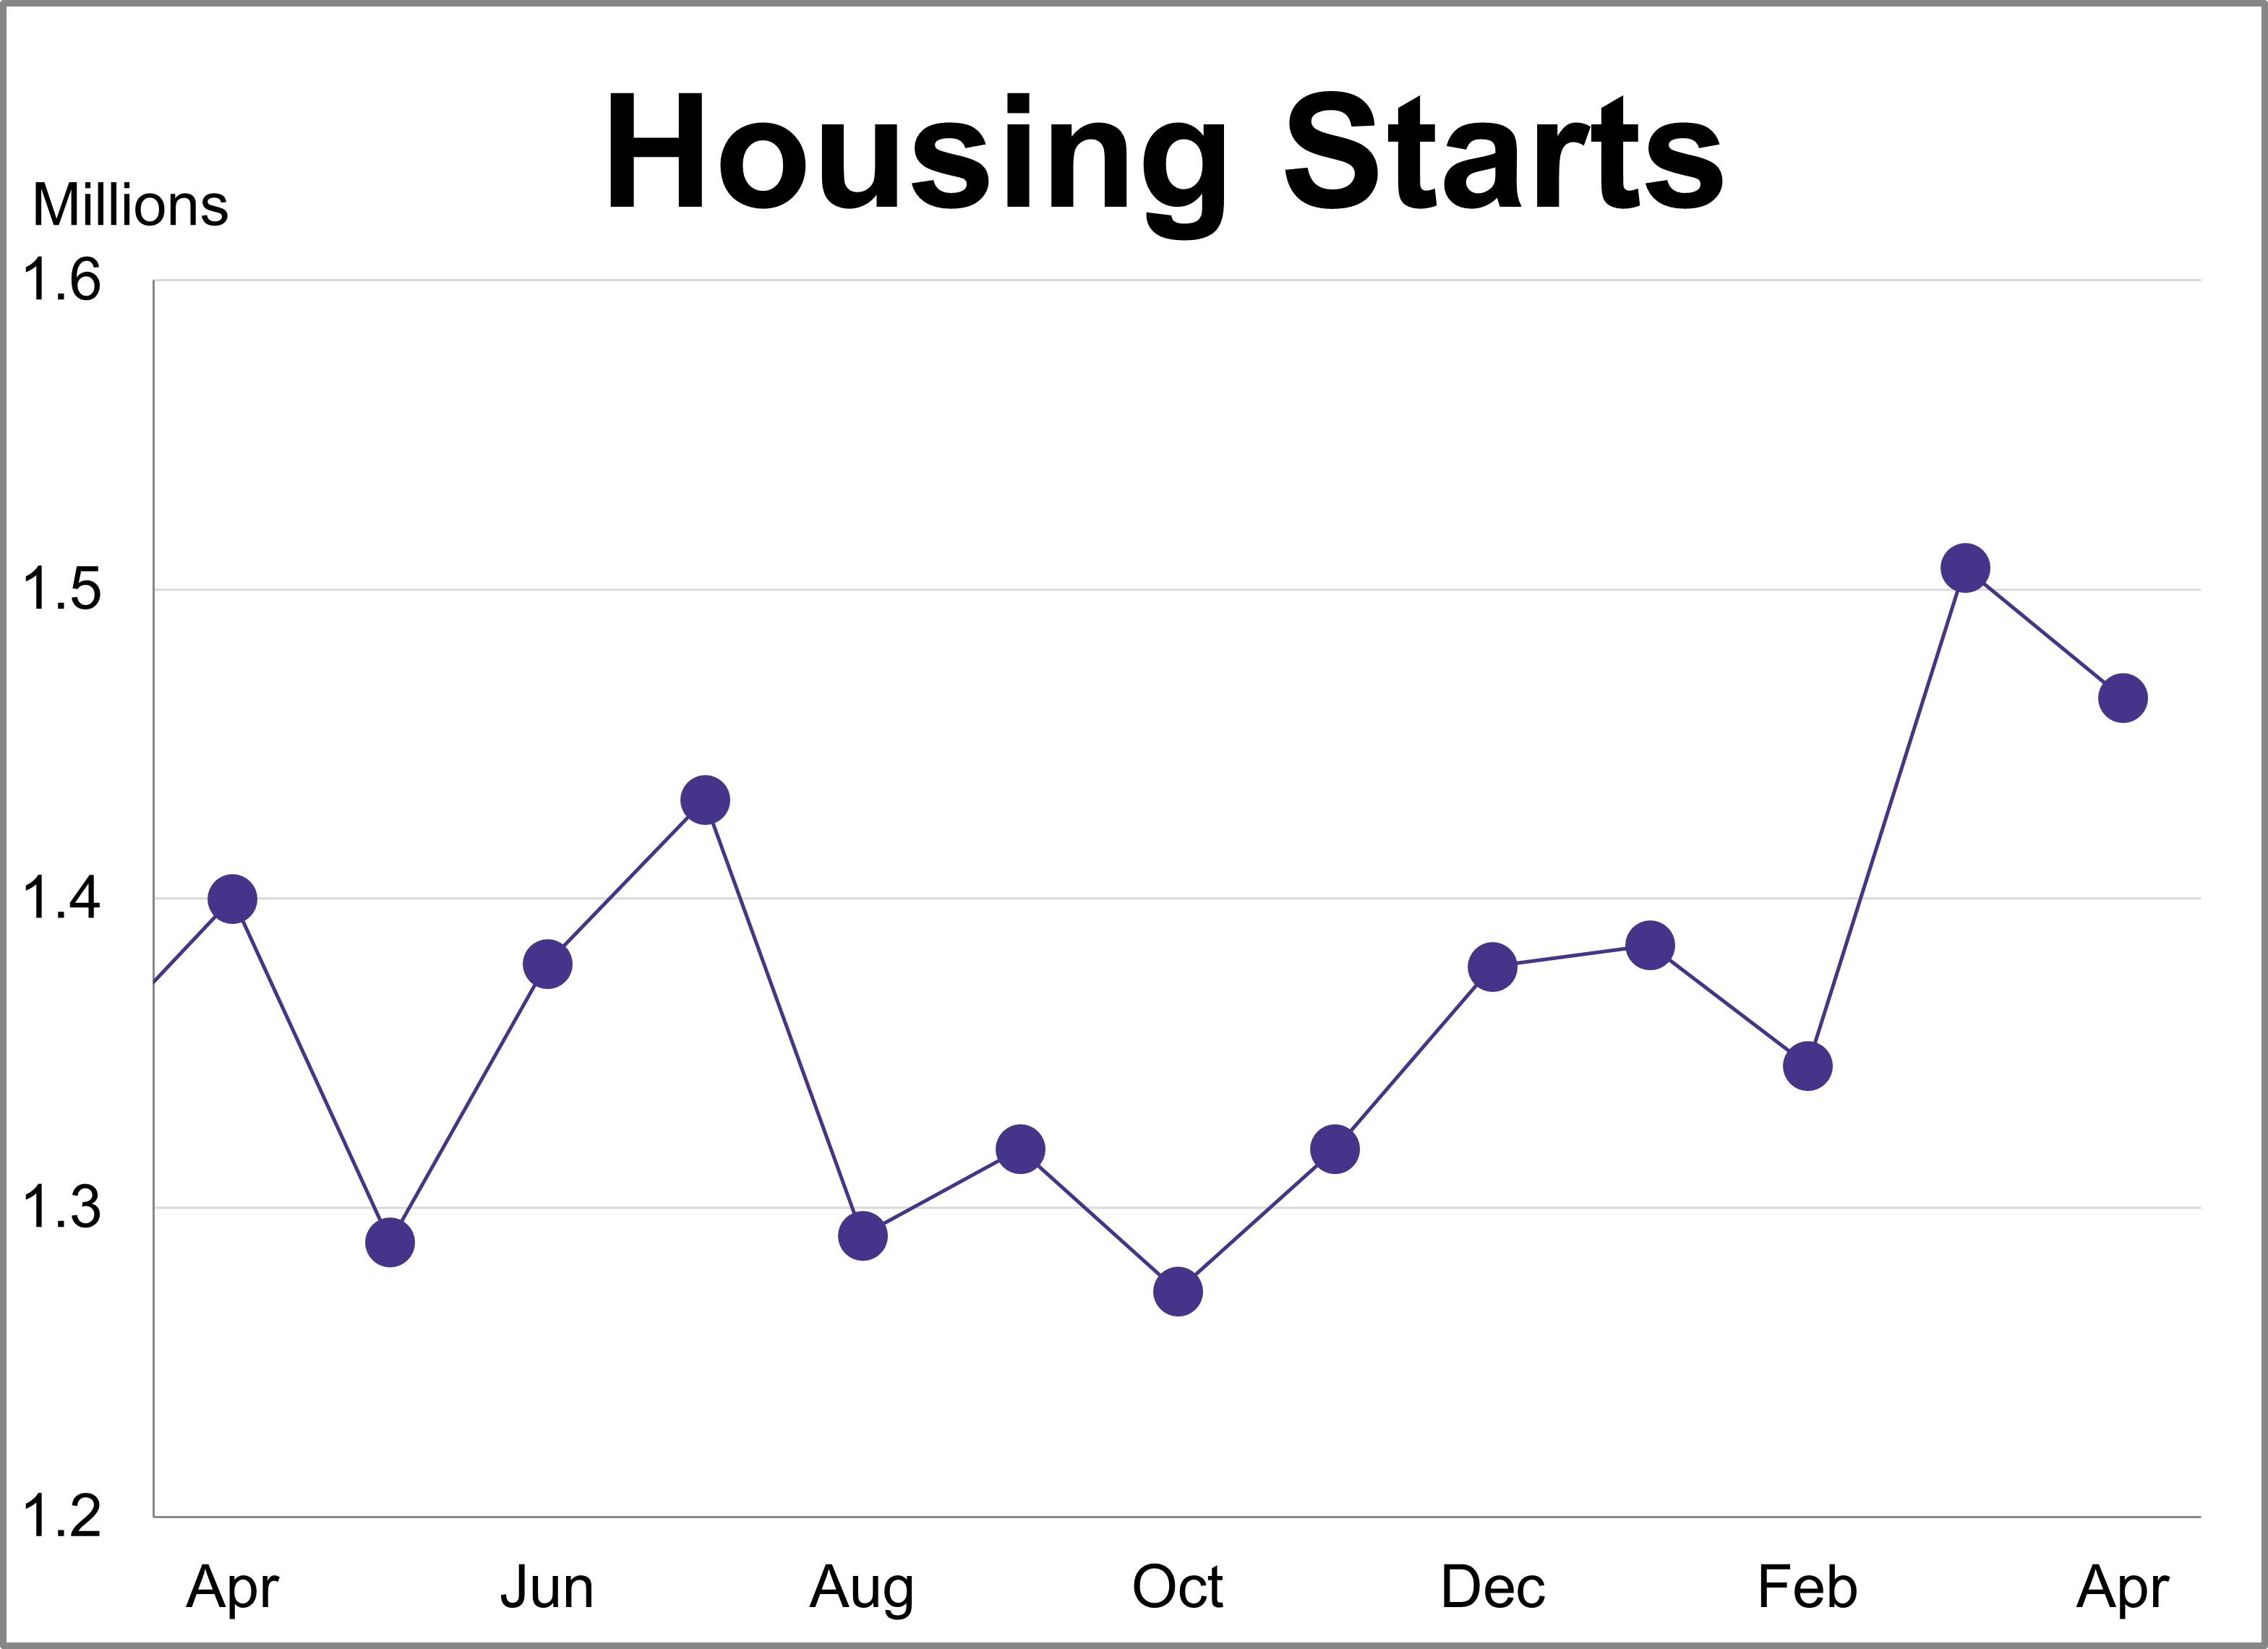
Housing starts fell 2.8% in April to a seasonally adjusted annual rate of 1.465 million. The latest reading exceeded the projected 1.420 million.
Margin debt rose for the first time in three months to a record high in April, coming in at $1.30 trillion. This marked a 6.8% increase from March and a 53.3% rise compared to the previous year.
Gas prices were relatively flat this week, remaining at their highest level in nearly four years. As of May 18th, weekly prices were down 1 cent for regular and were unchanged for premium.
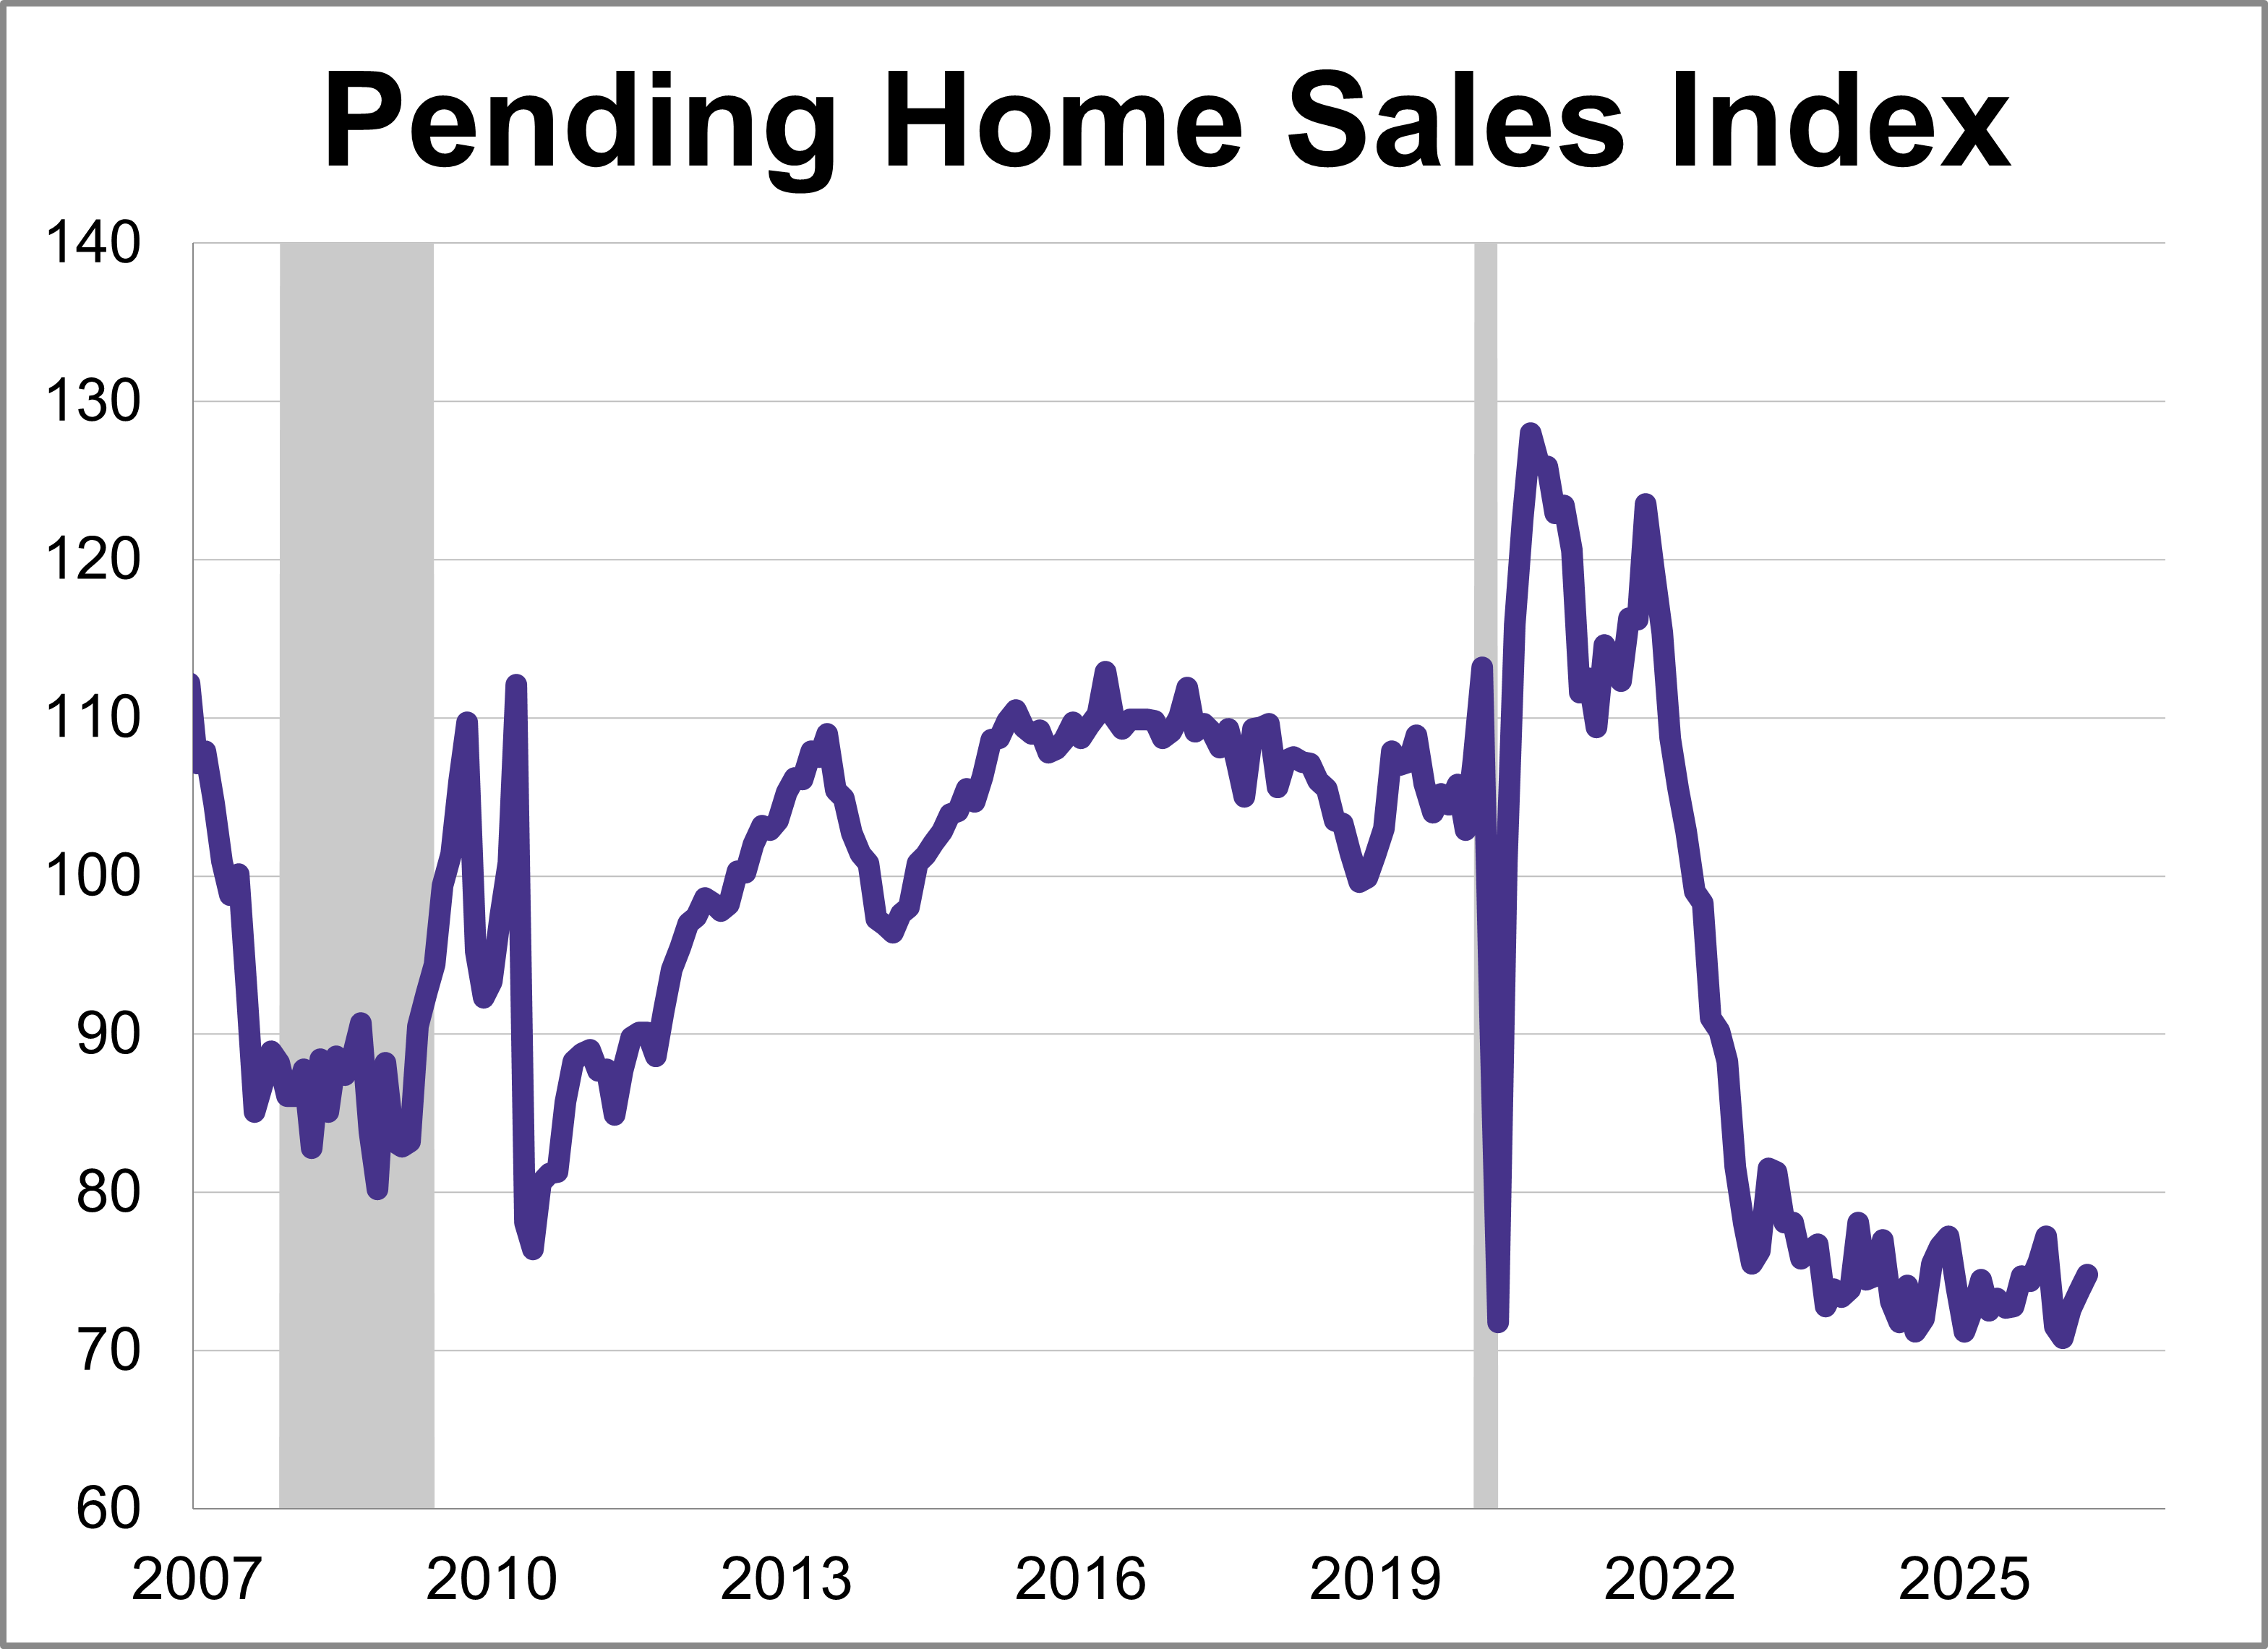
The National Association of Realtors® (NAR) pending home sales index rose 1.4% in April to 74.8, markings its third consecutive increase and highest level since November.
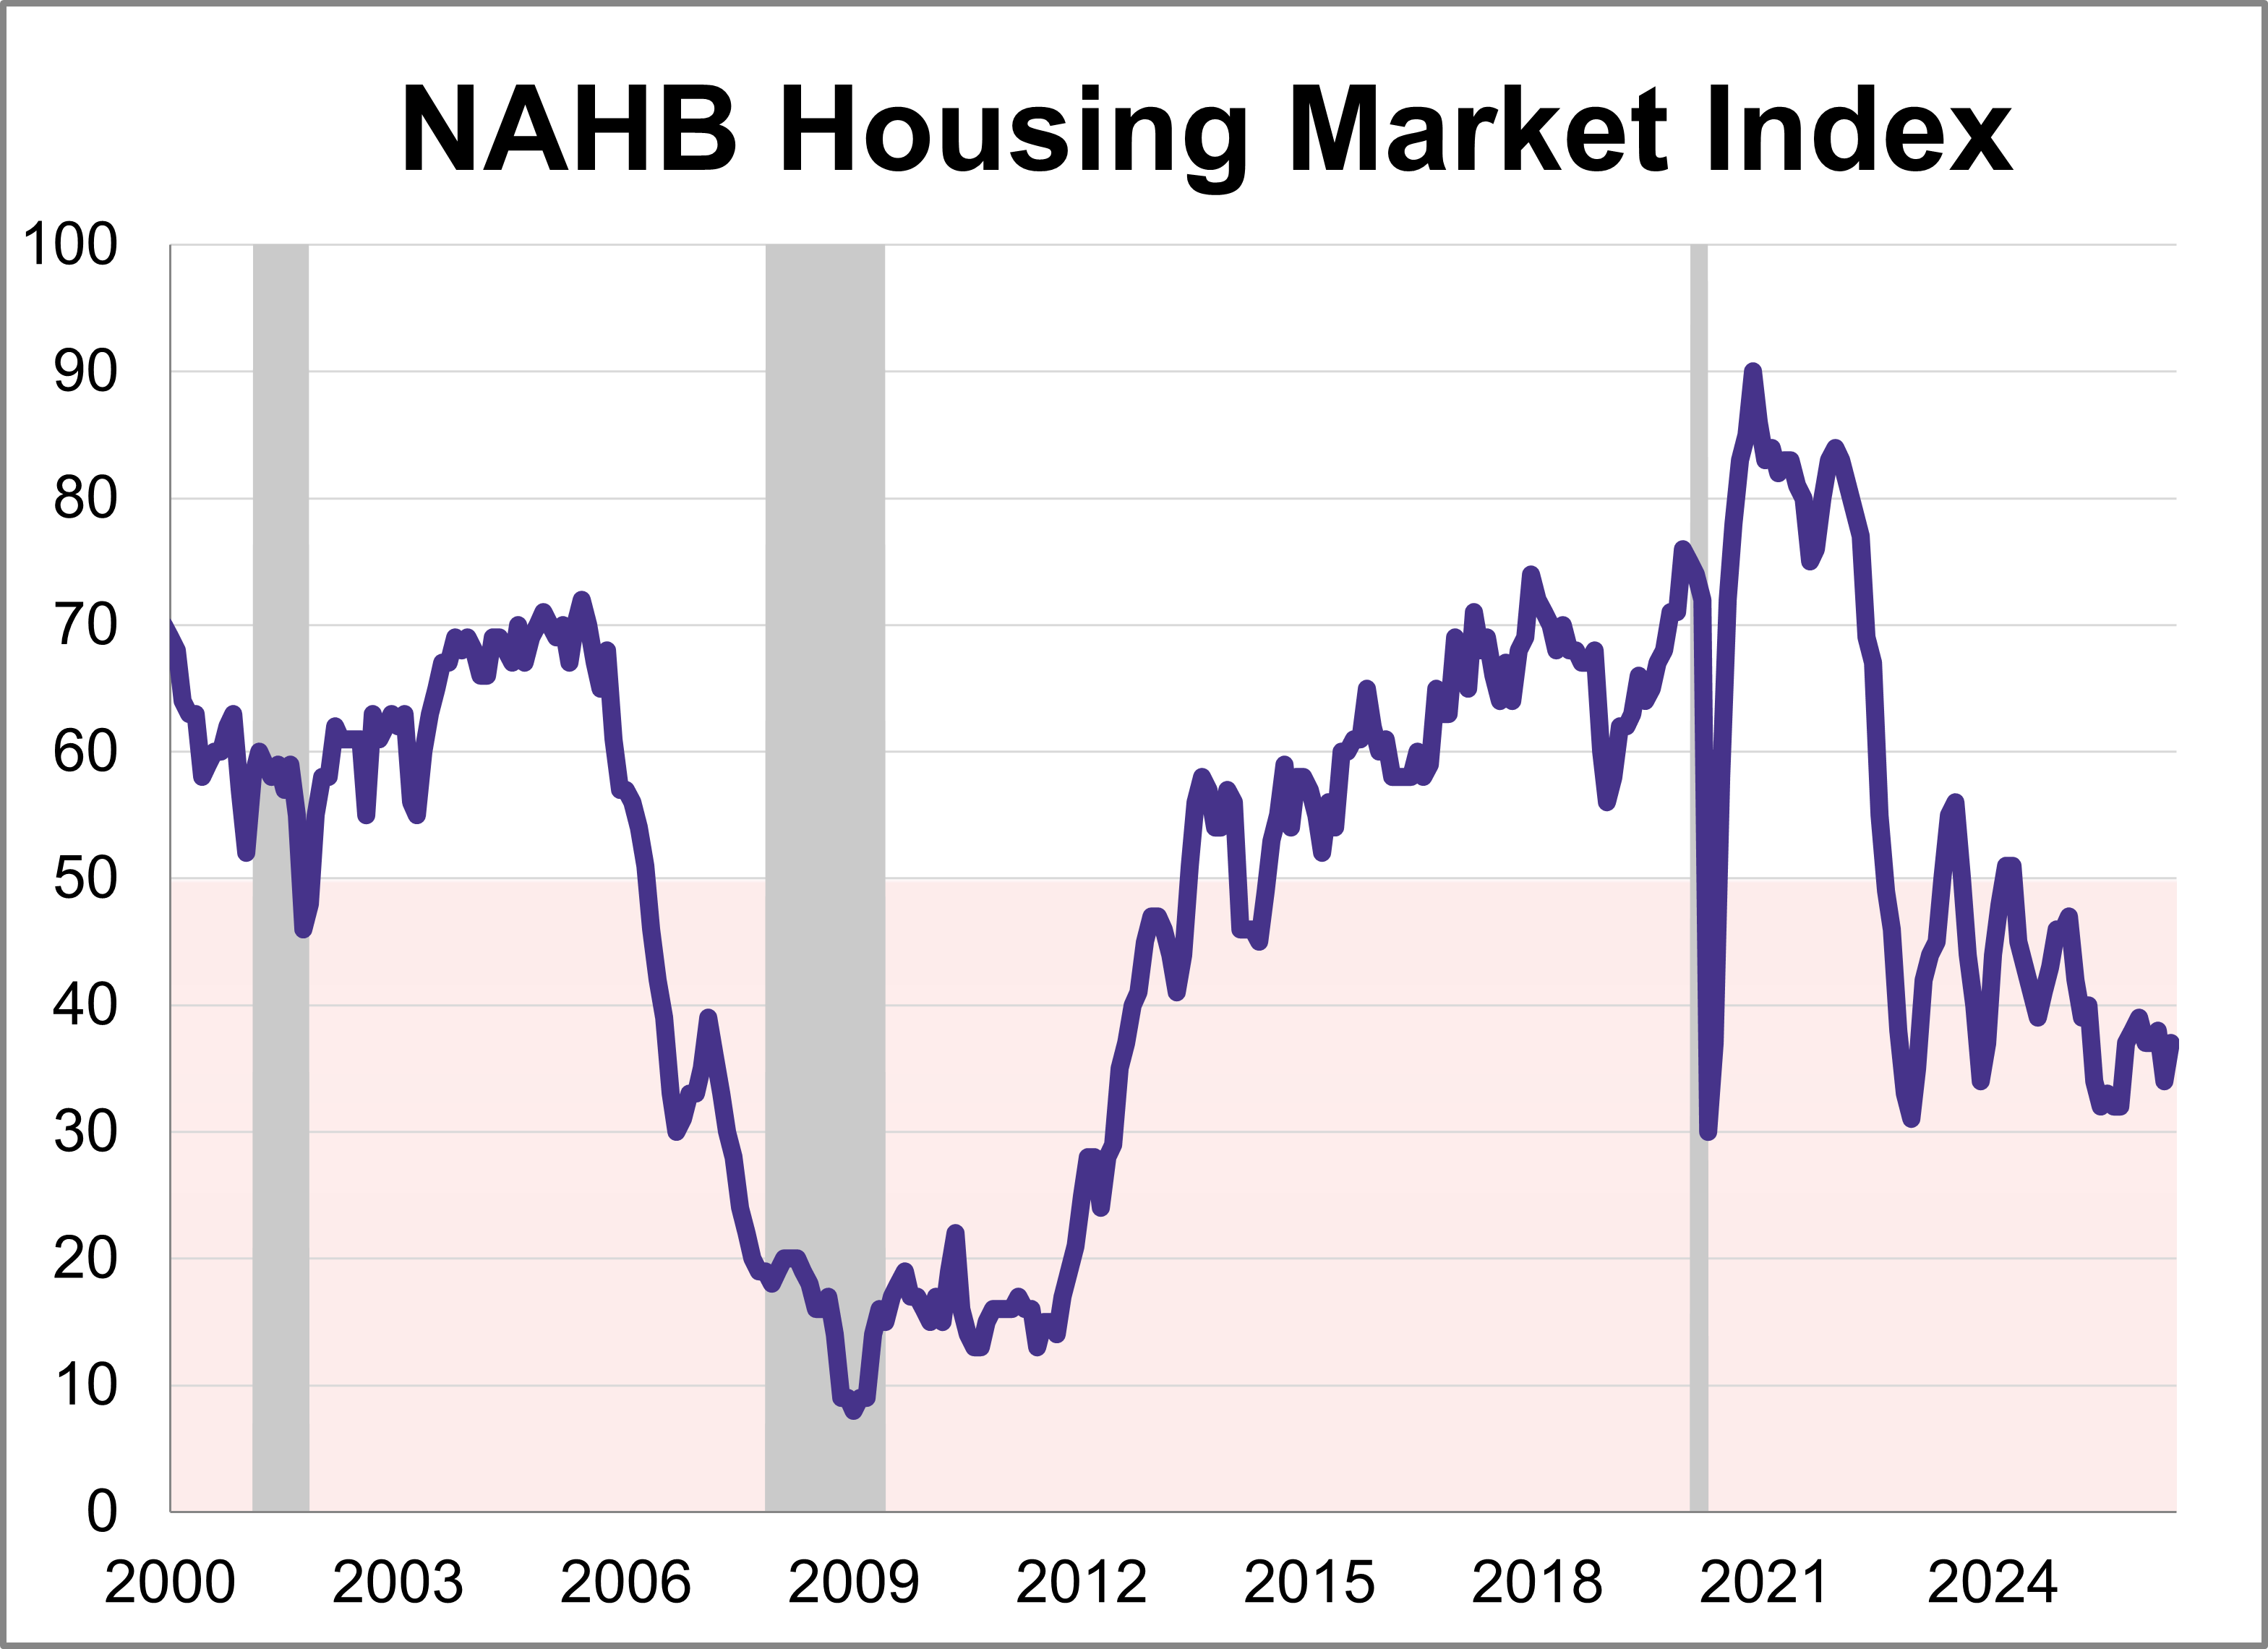
Builder confidence posted a modest gain in May despite persistent affordability challenges and economic uncertainty. The National Association of Home Builders (NAHB) Housing Market Index (HMI) rose 3 points from April to 37 this month, marking the 25th consecutive negative reading.
The U.S. economic landscape in April was defined by a significant rebound in inflation across both consumer and wholesale sectors, complicating the path for future monetary policy.
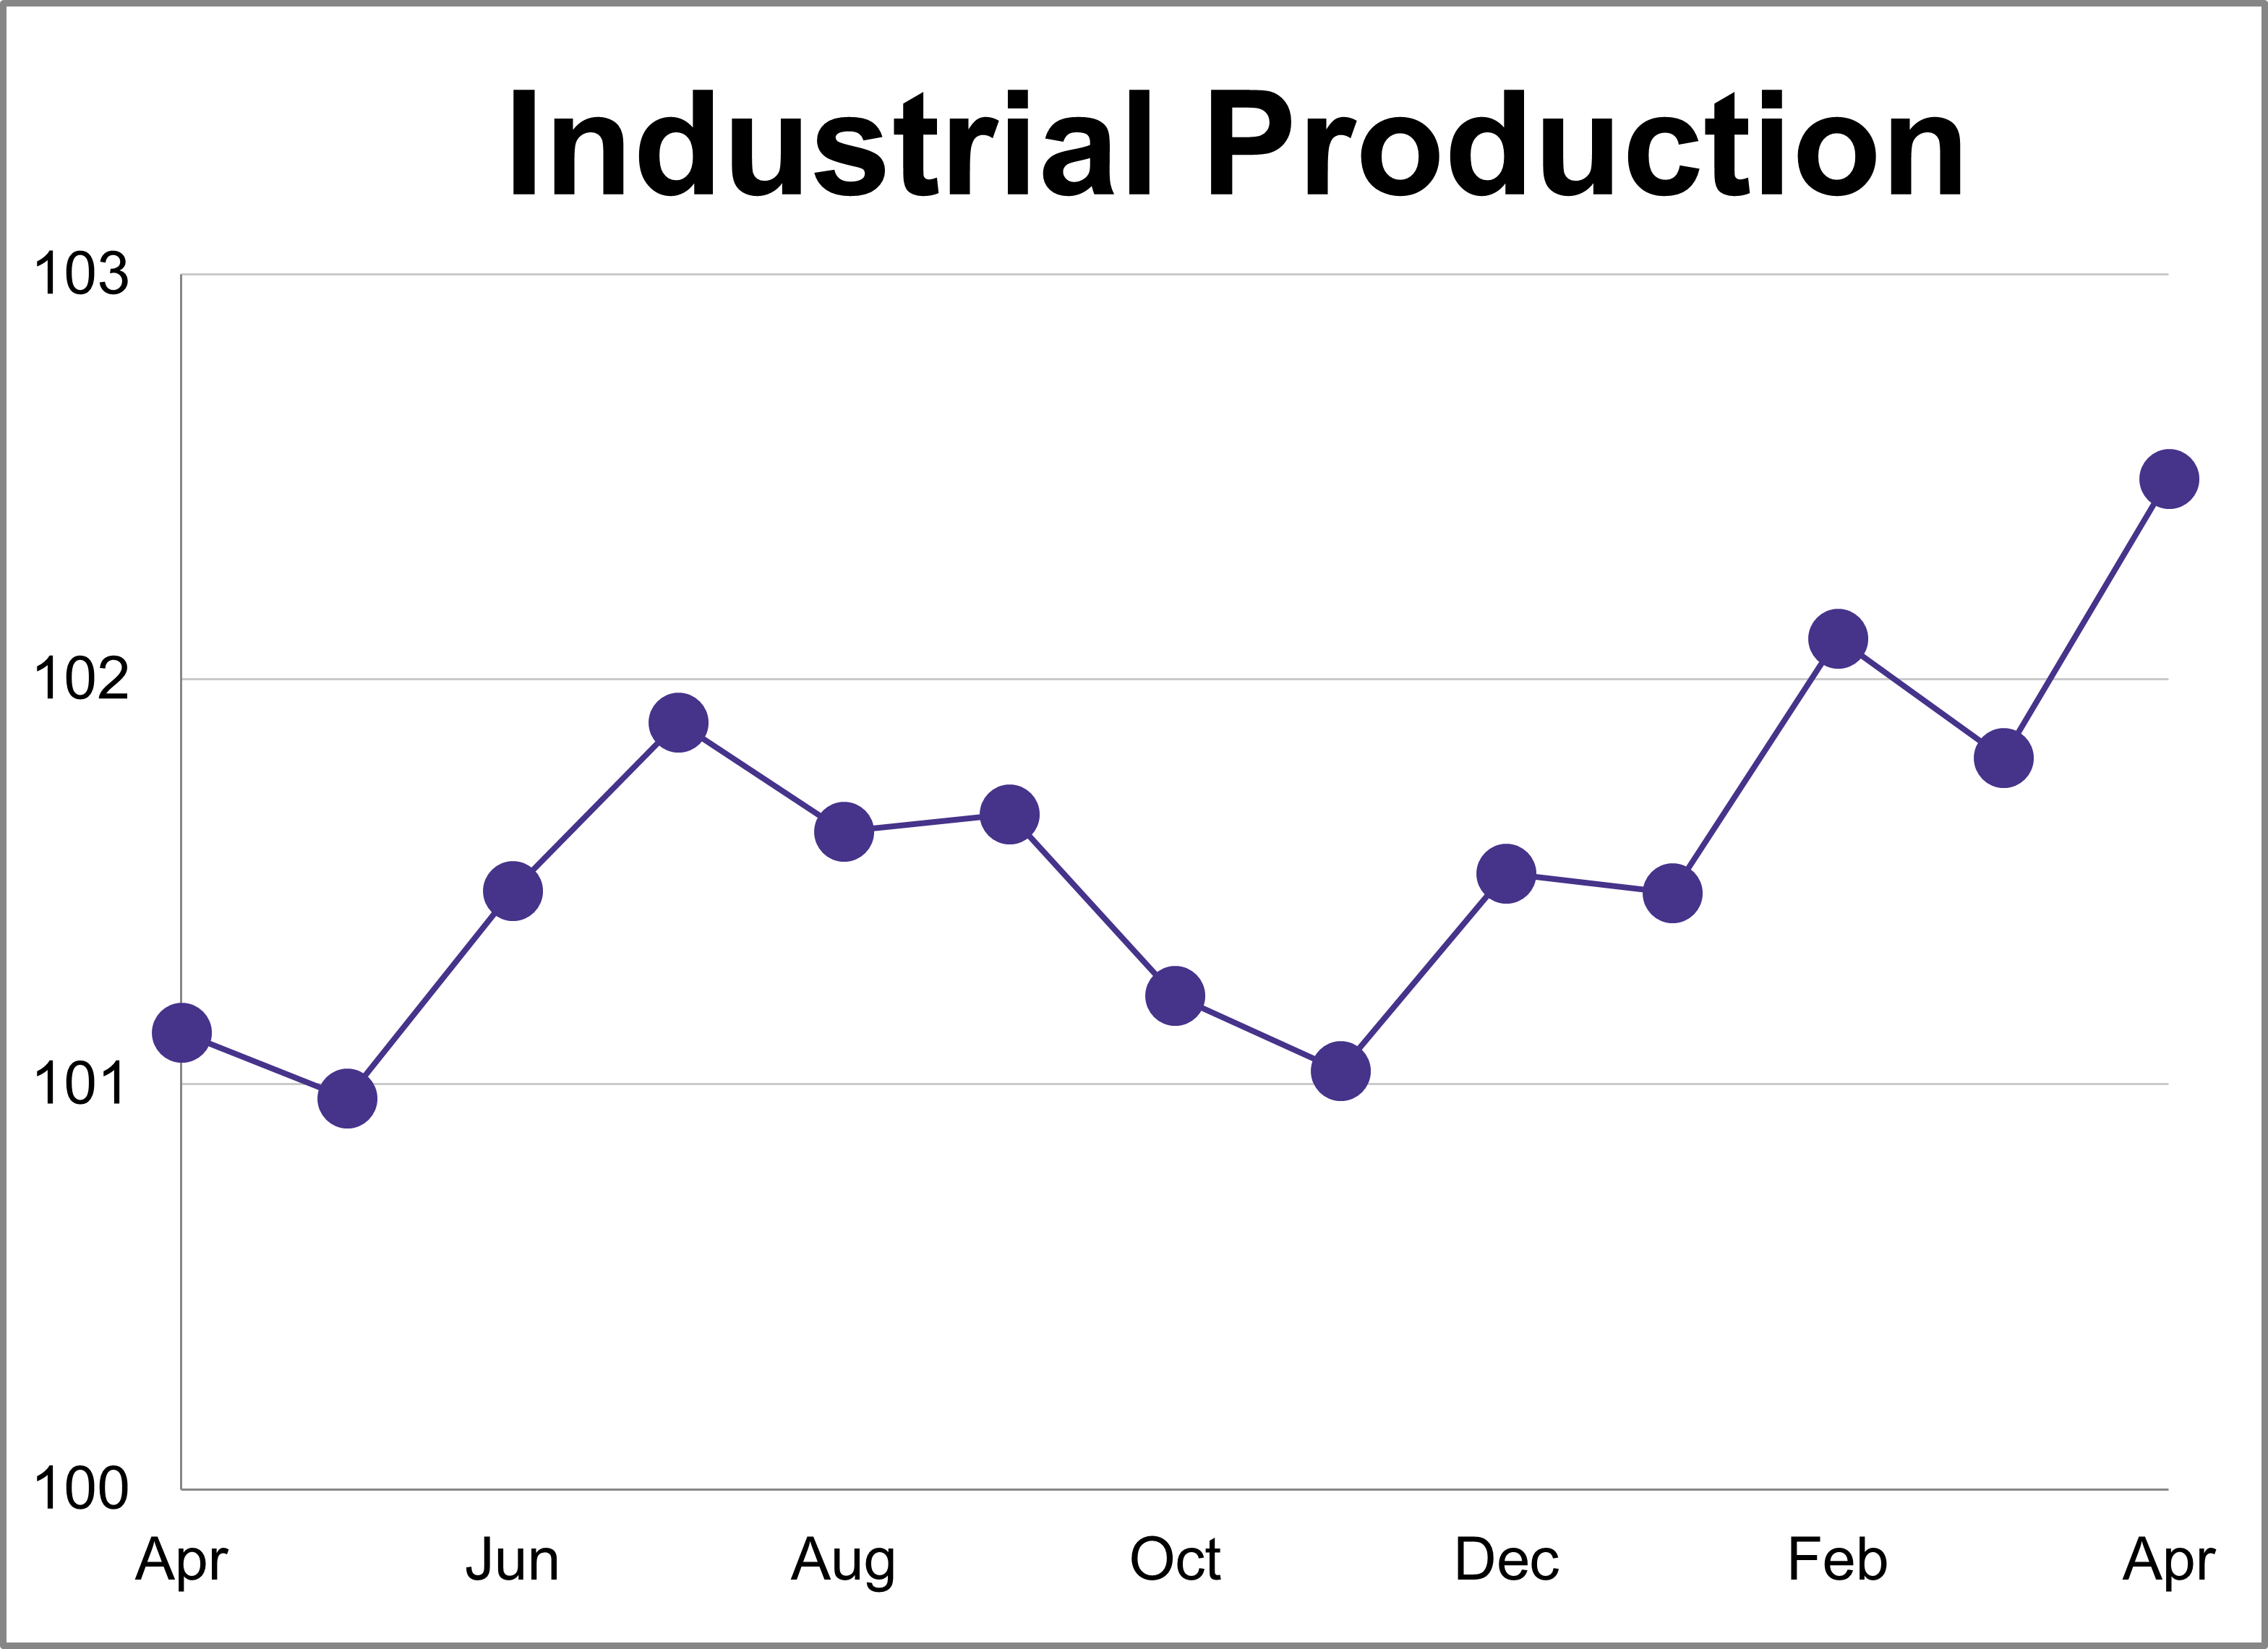
Industrial production rose more than expected in April, increasing 0.7% after a 0.3% decline in March. This was higher than the expected 0.3% growth and marks a 1.4% increase compared to one year ago.
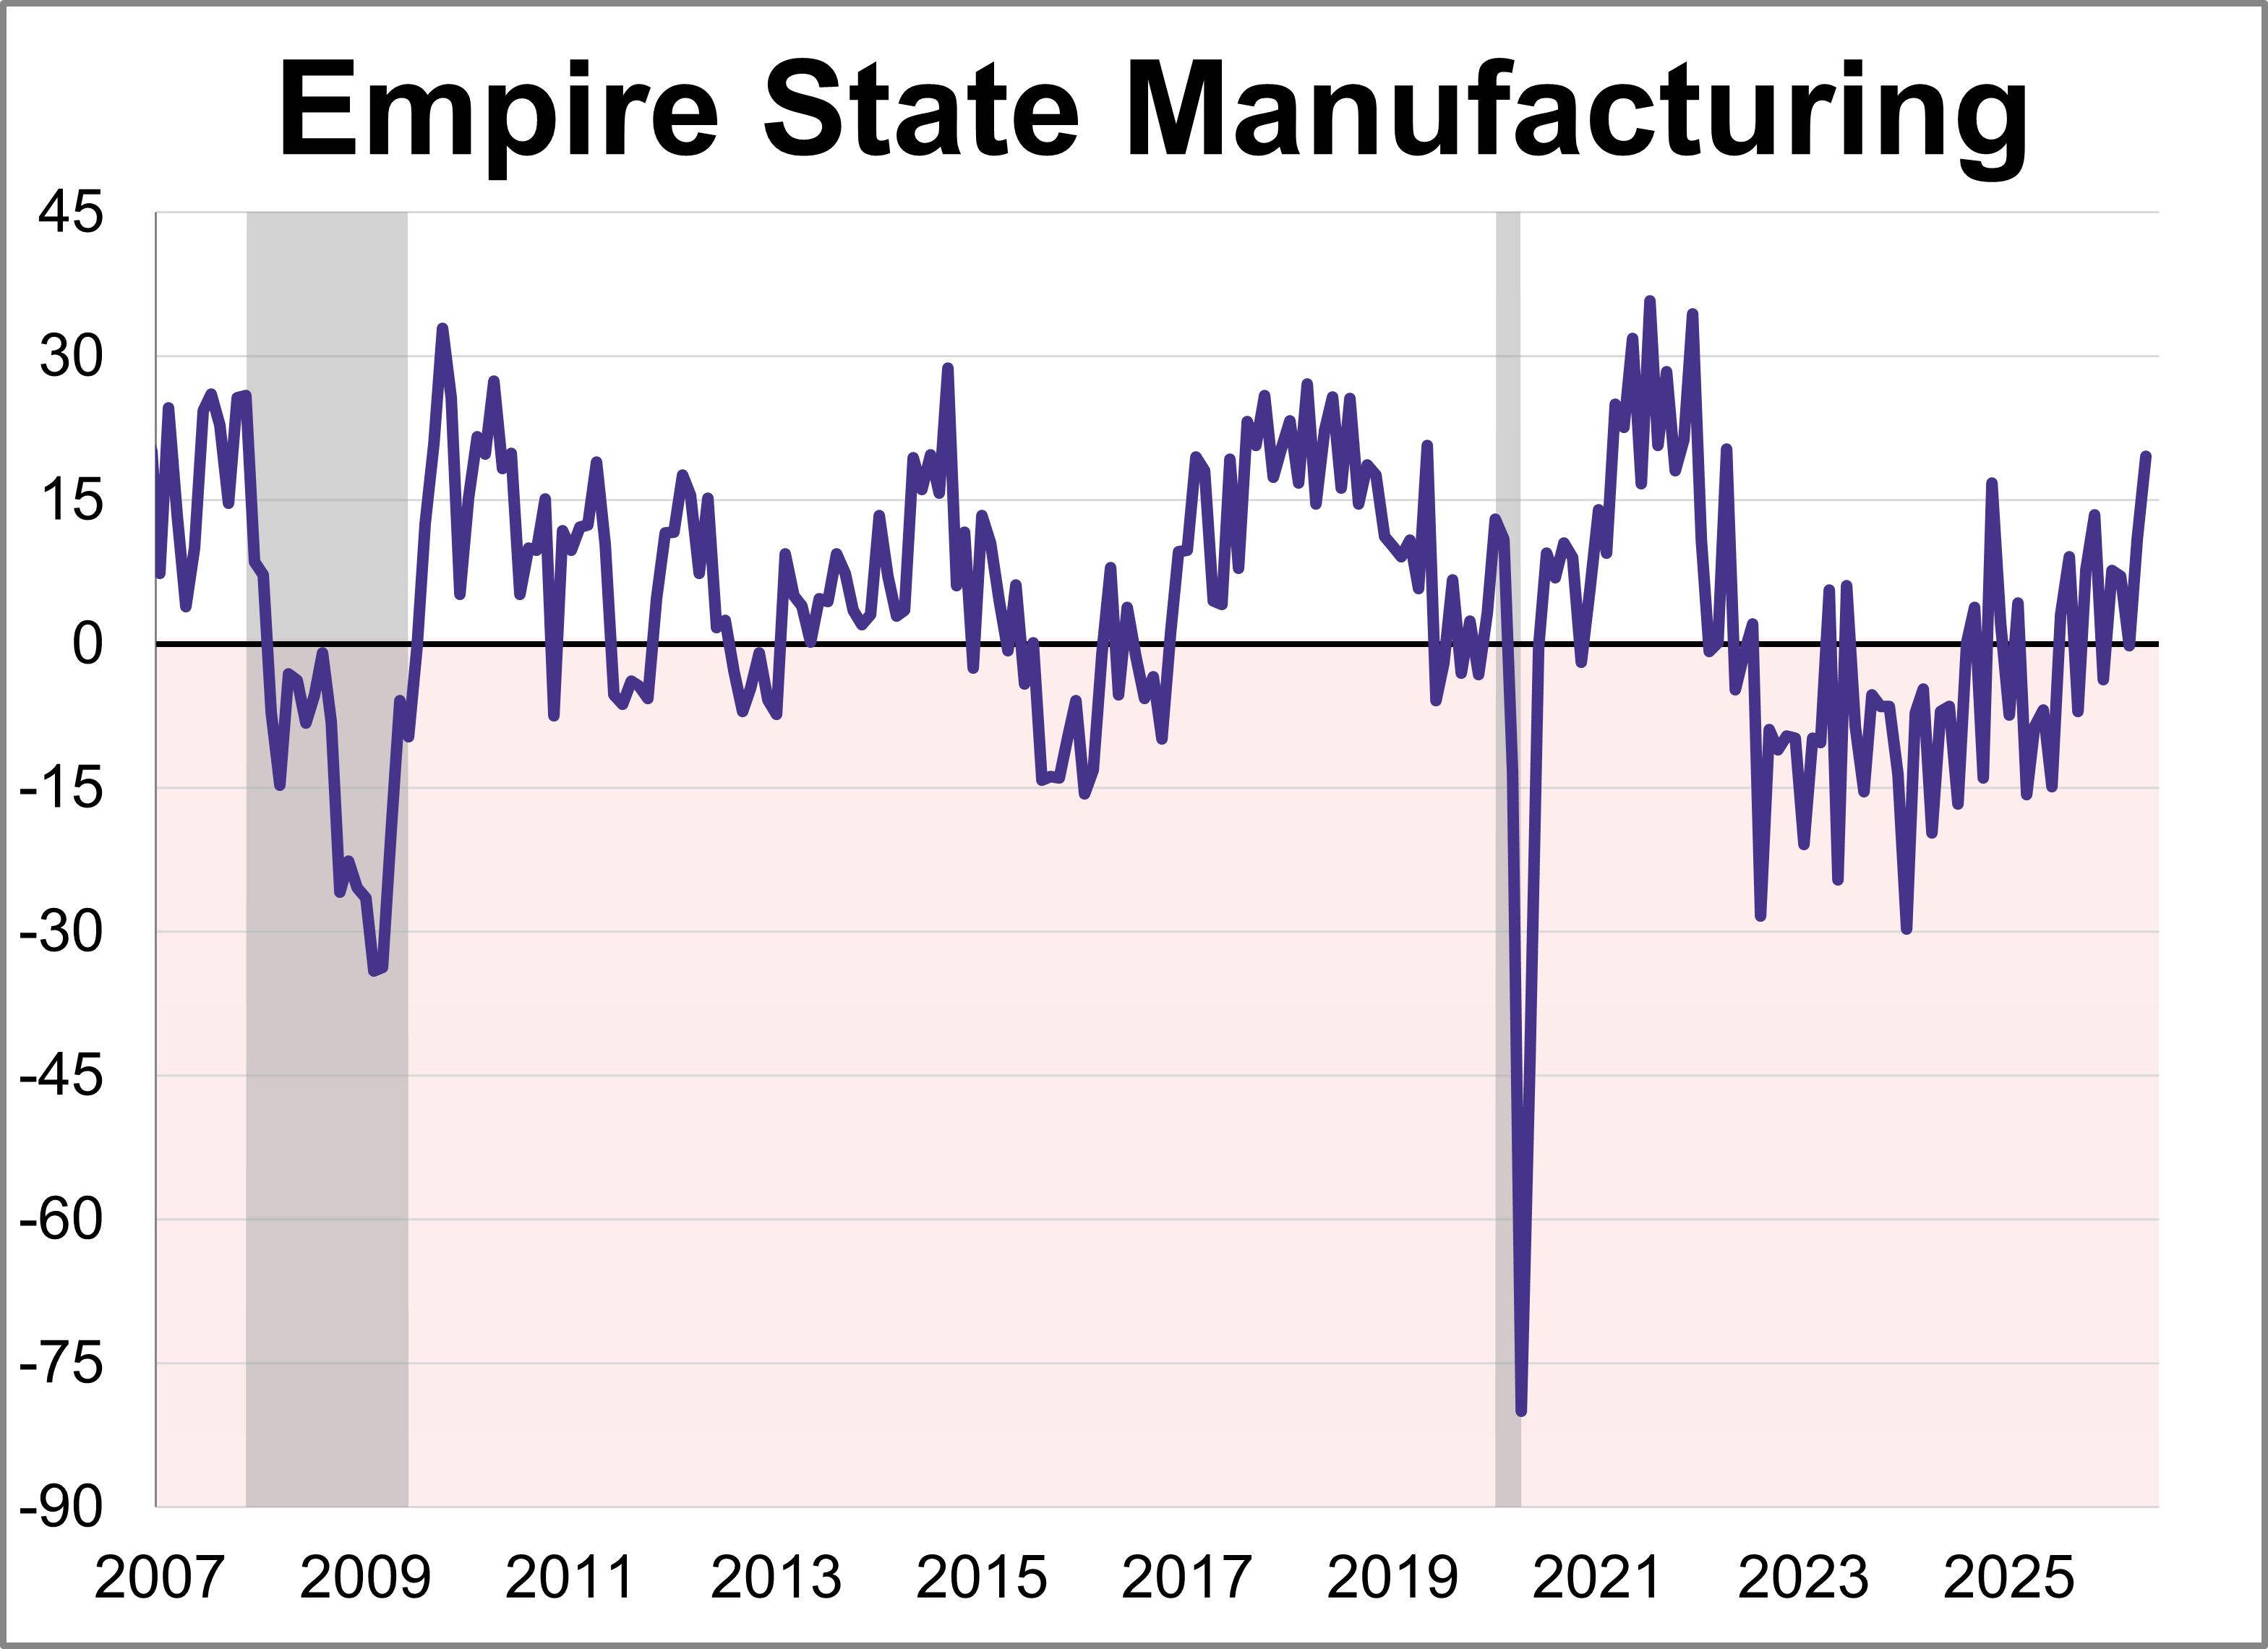
Manufacturing activity grew strongly in New York State, according to the Empire State Manufacturing May survey. The diffusion index for General Business Conditions rose 8.6 points to 19.6, its highest level in over four years.
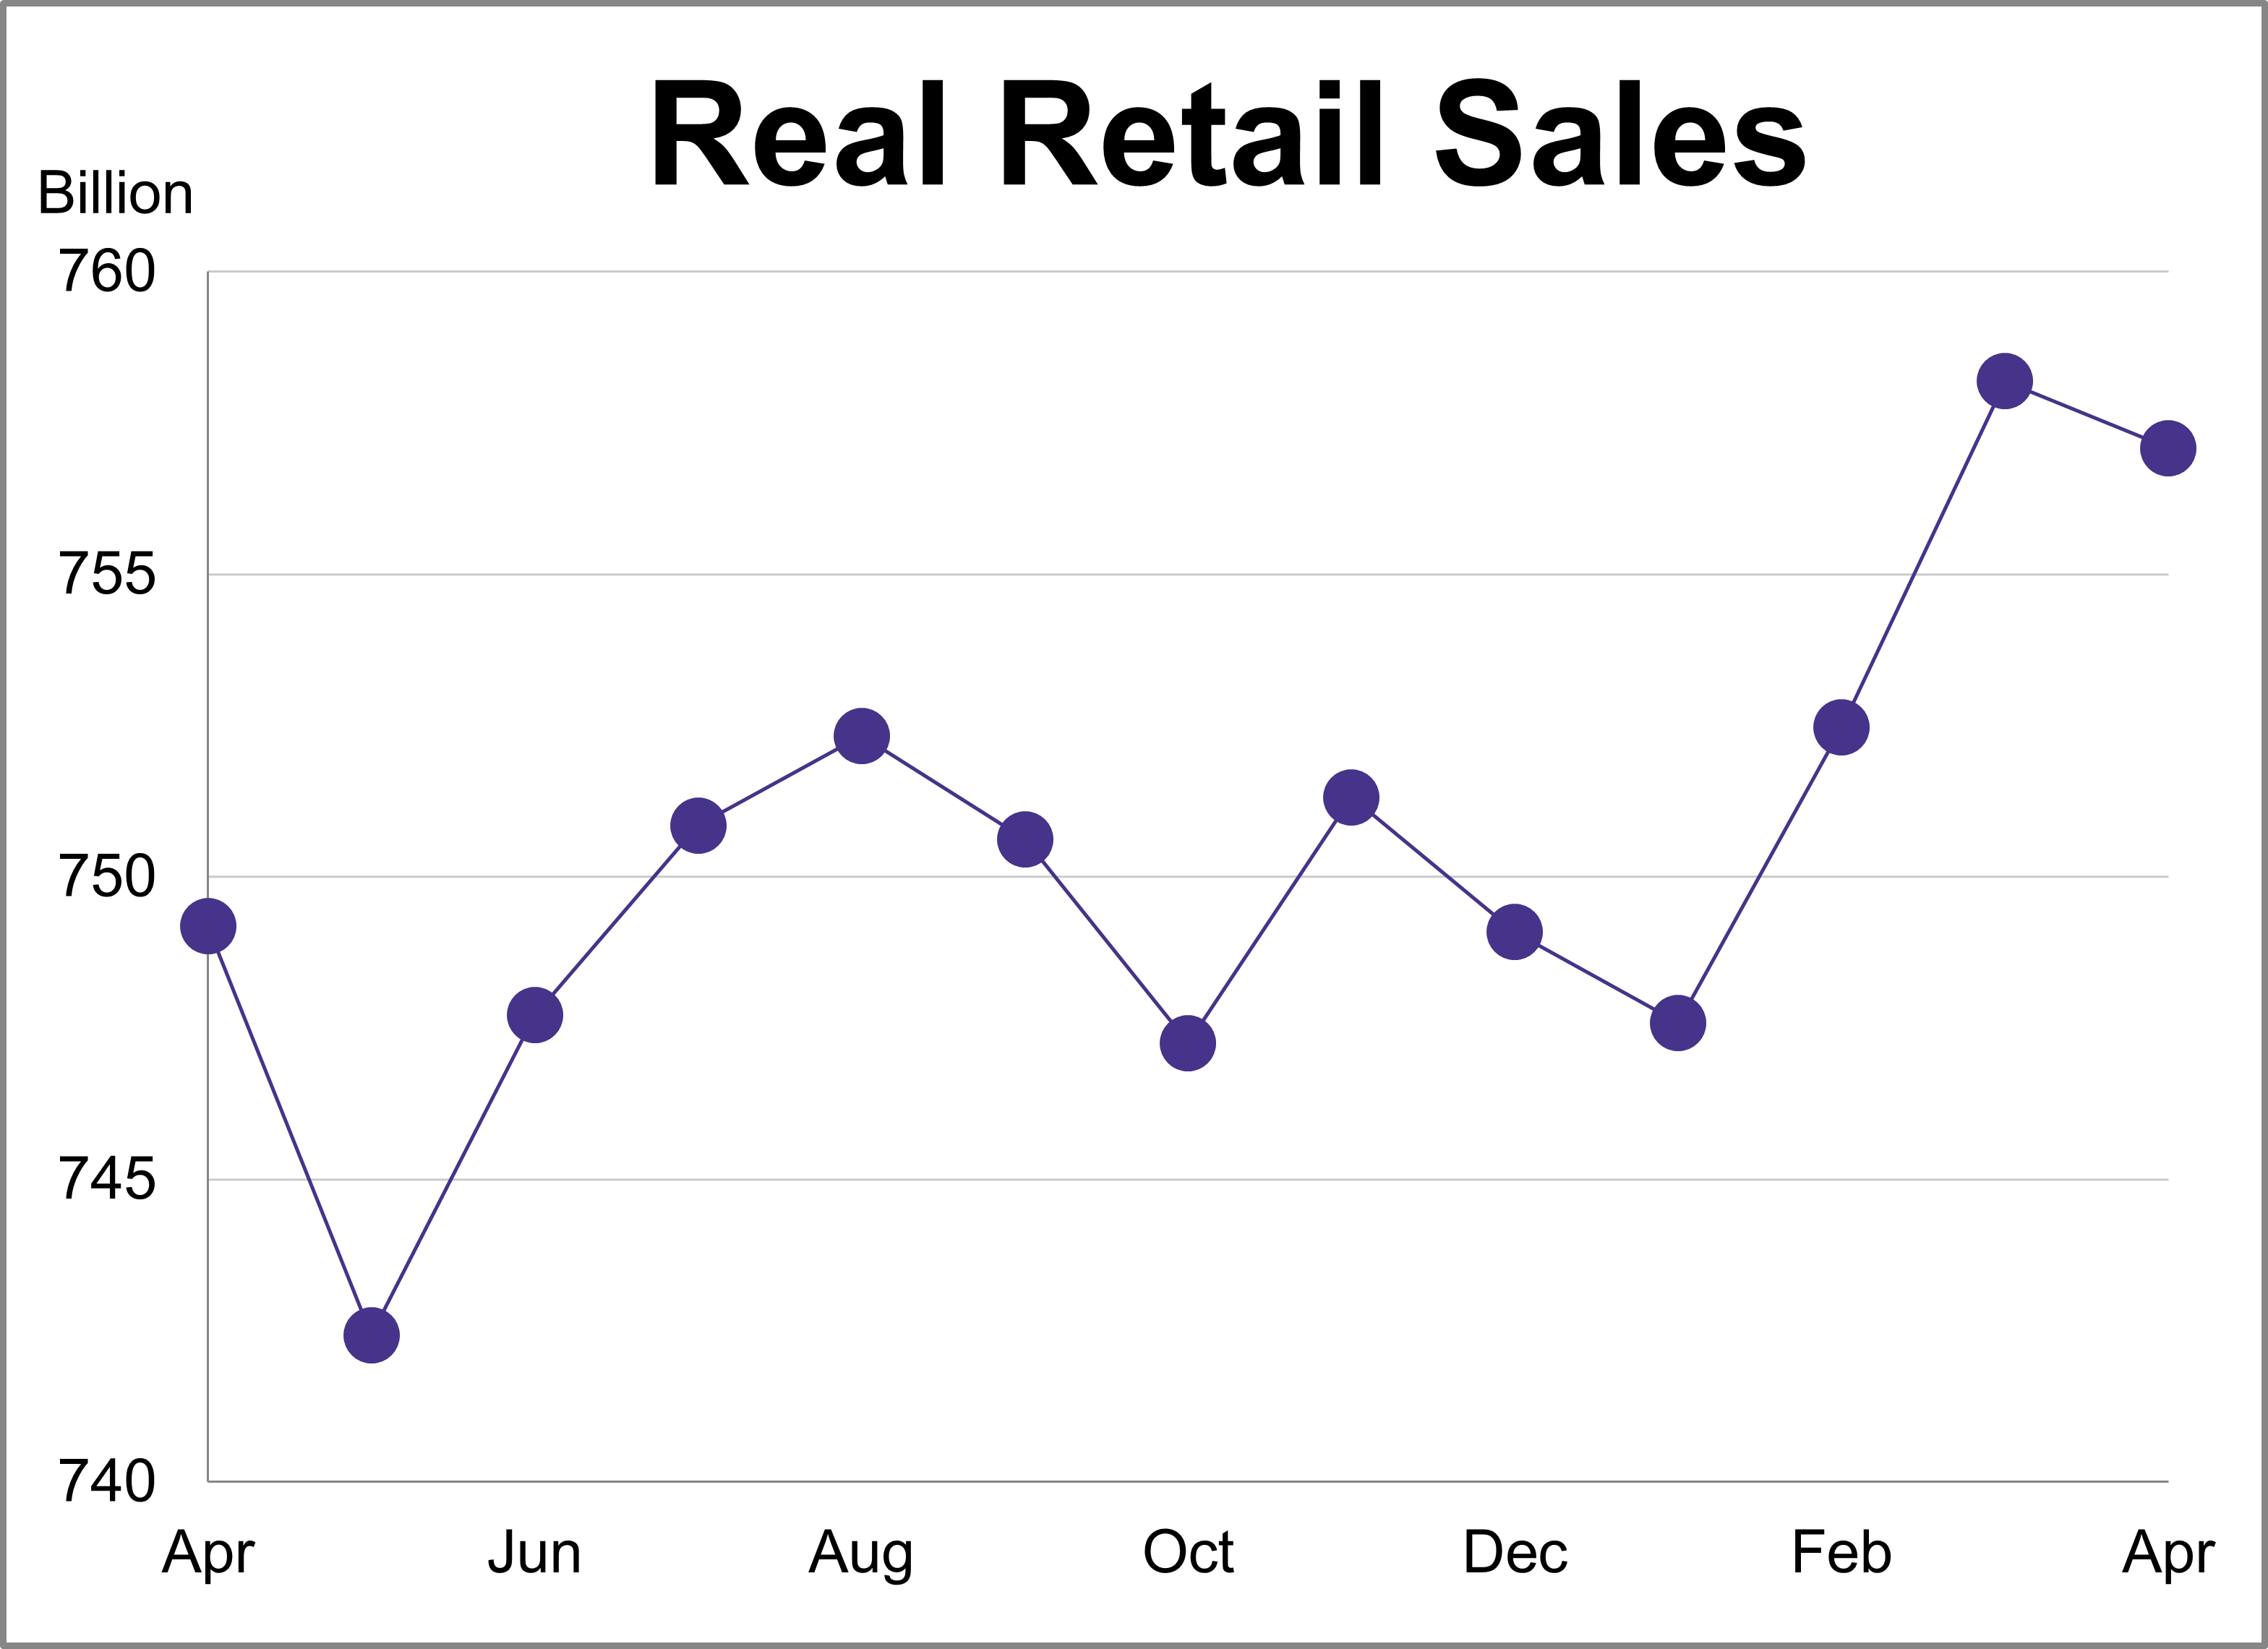
Nominal retail sales were up 0.49% month-over-month and up 4.87% year-over-year in April. However, after adjusting for inflation, real retail sales were down 0.15% month-over-month and up 1.05% year-over-year.
According to the Census Bureau’s Advance Retail Sales Report, consumer spending climbed for the third consecutive month in April. While headline sales rose 0.5% (as expected), this marked a deceleration from March’s 1.6% surge, with much of the gain driven by higher prices at the pump.
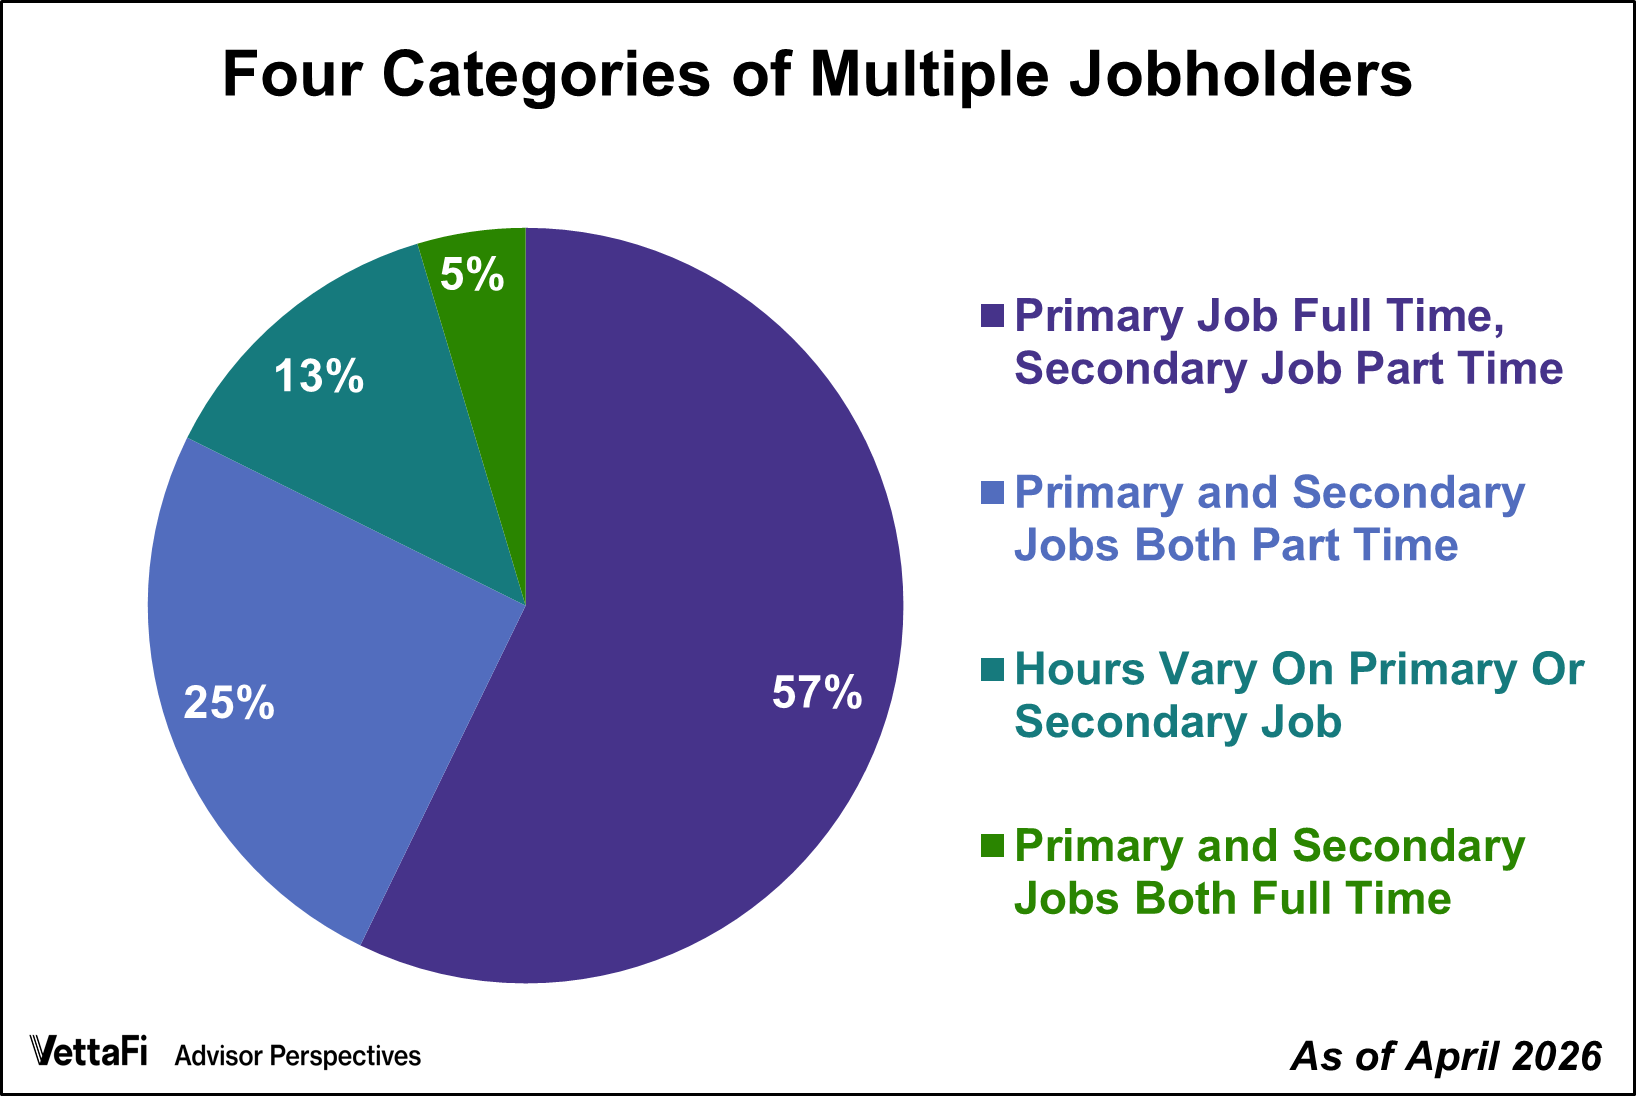
Multiple jobholders accounted for 5.2% of civilian employment in April.
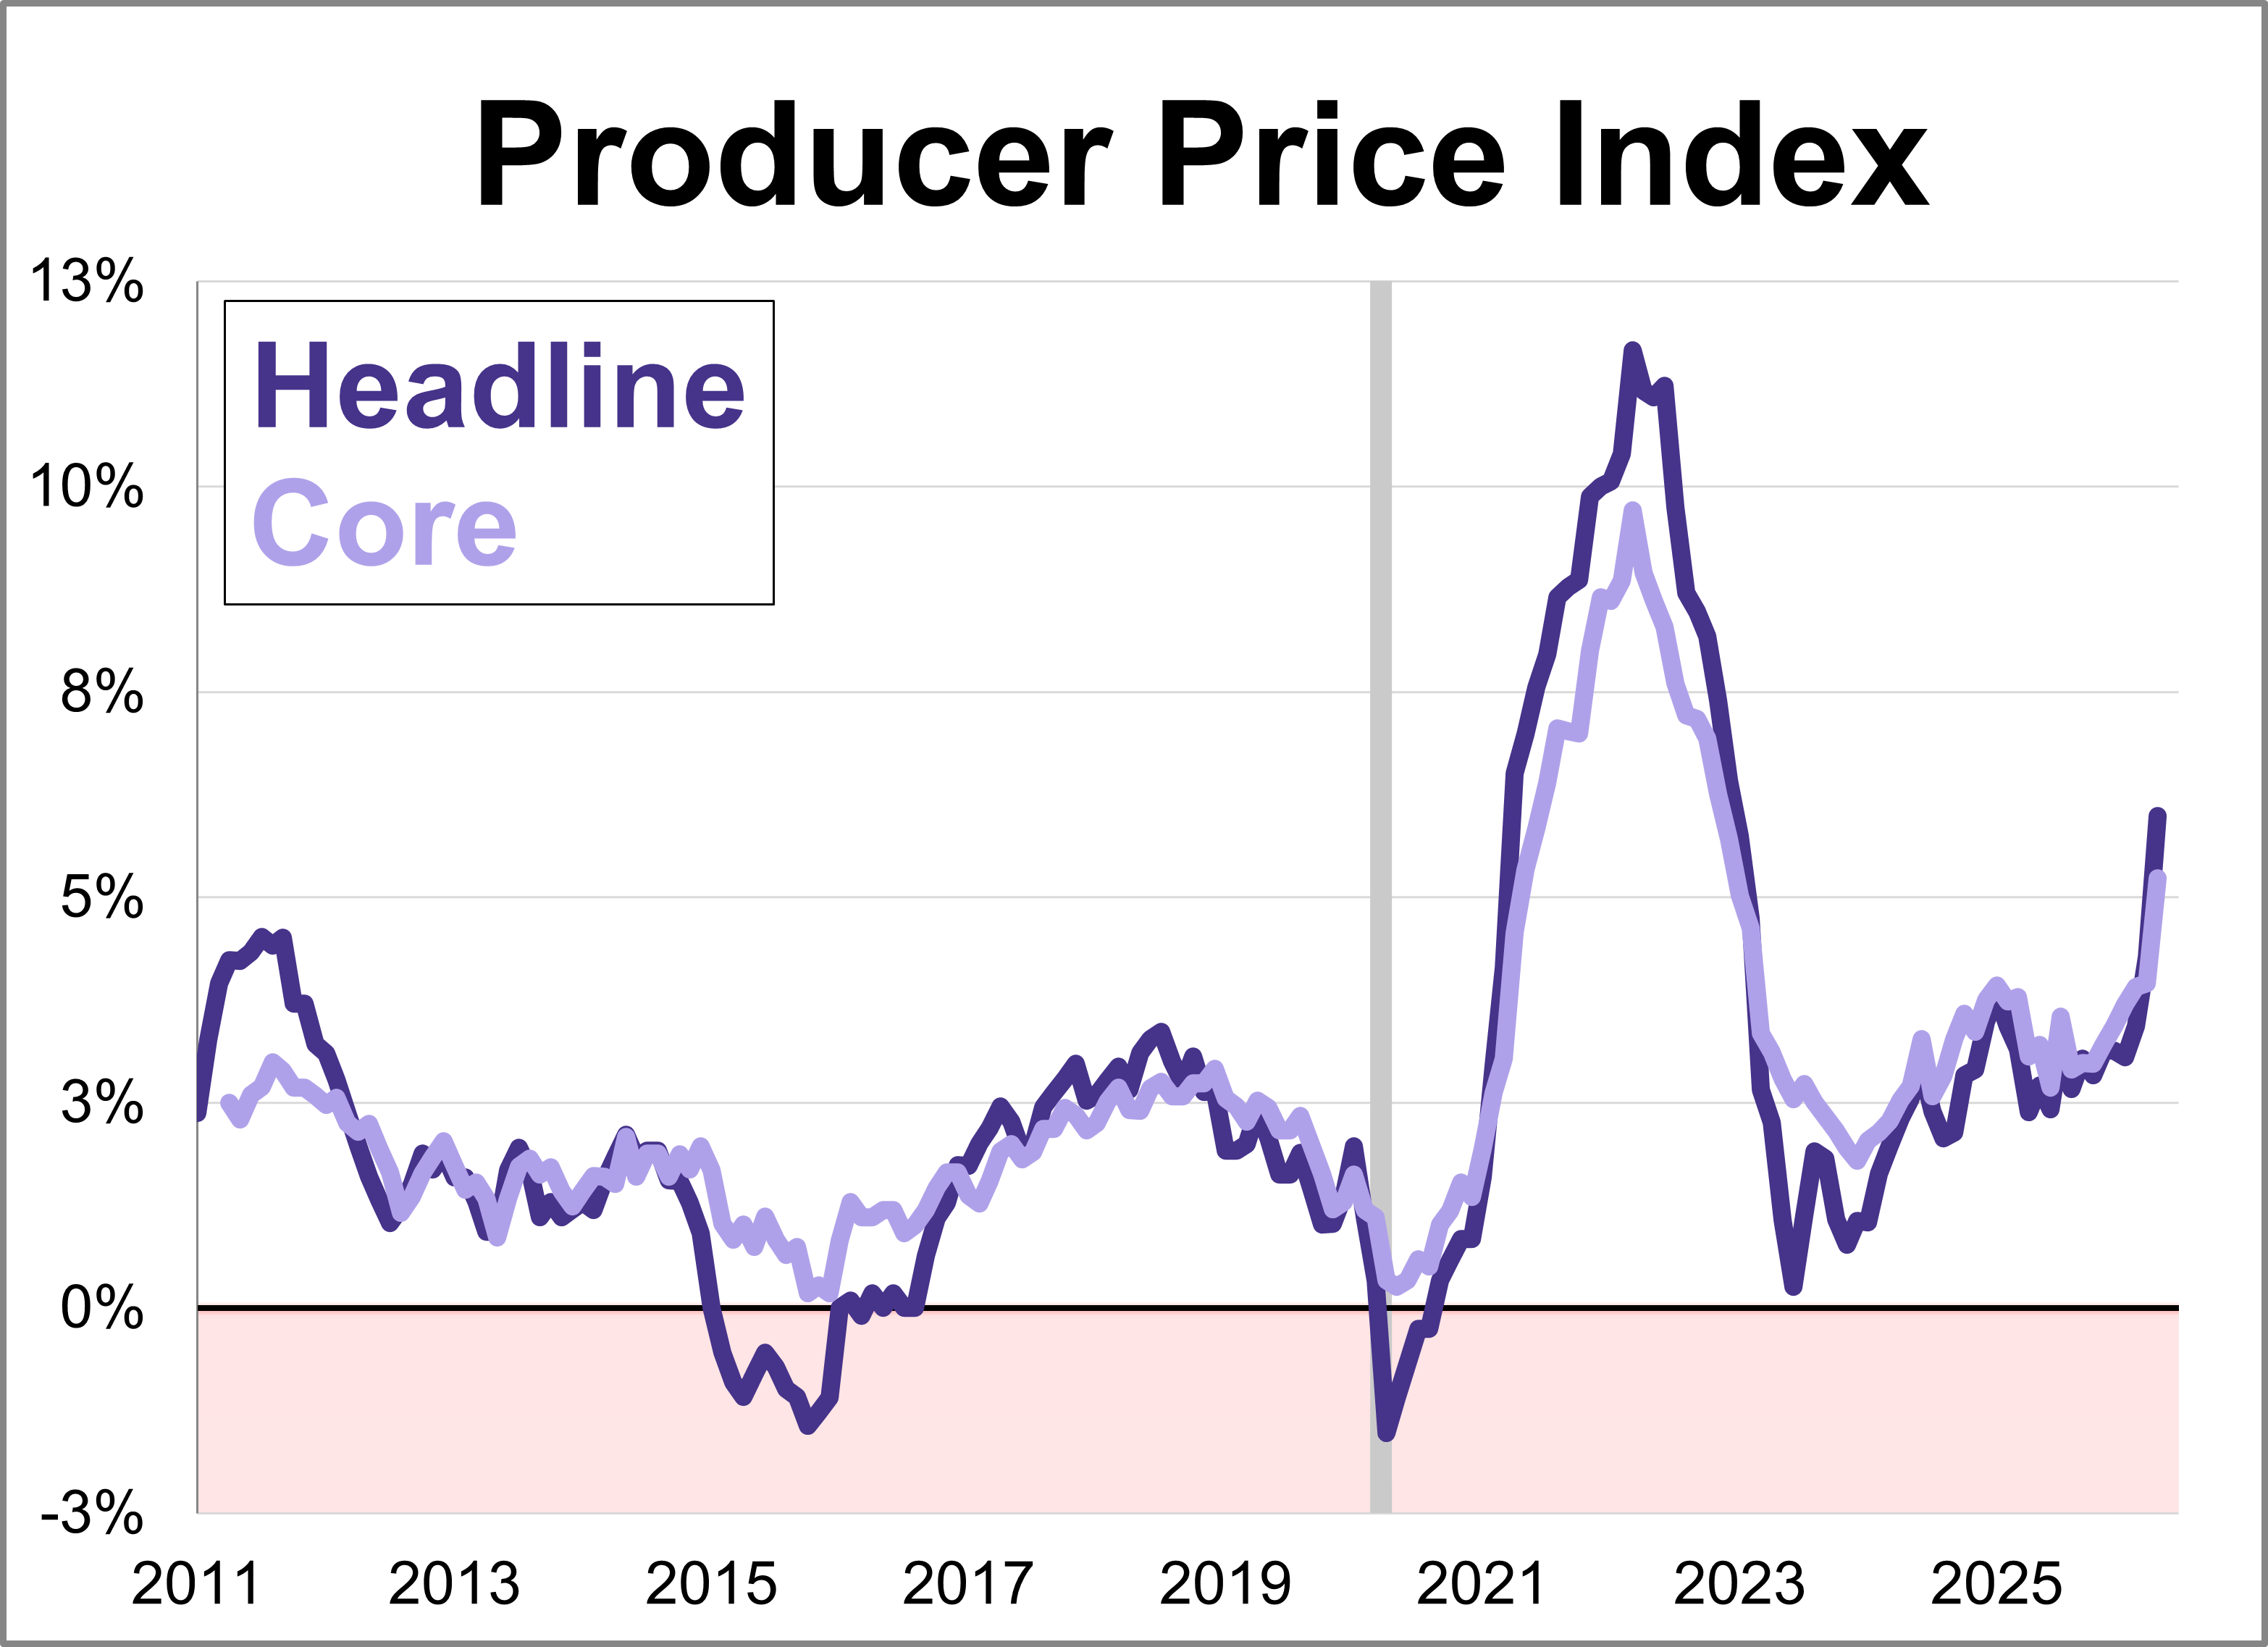
March’s Producer Price Index (PPI) data offered a significant reprieve for inflation watchers, as wholesale price growth came in broadly softer than expected.
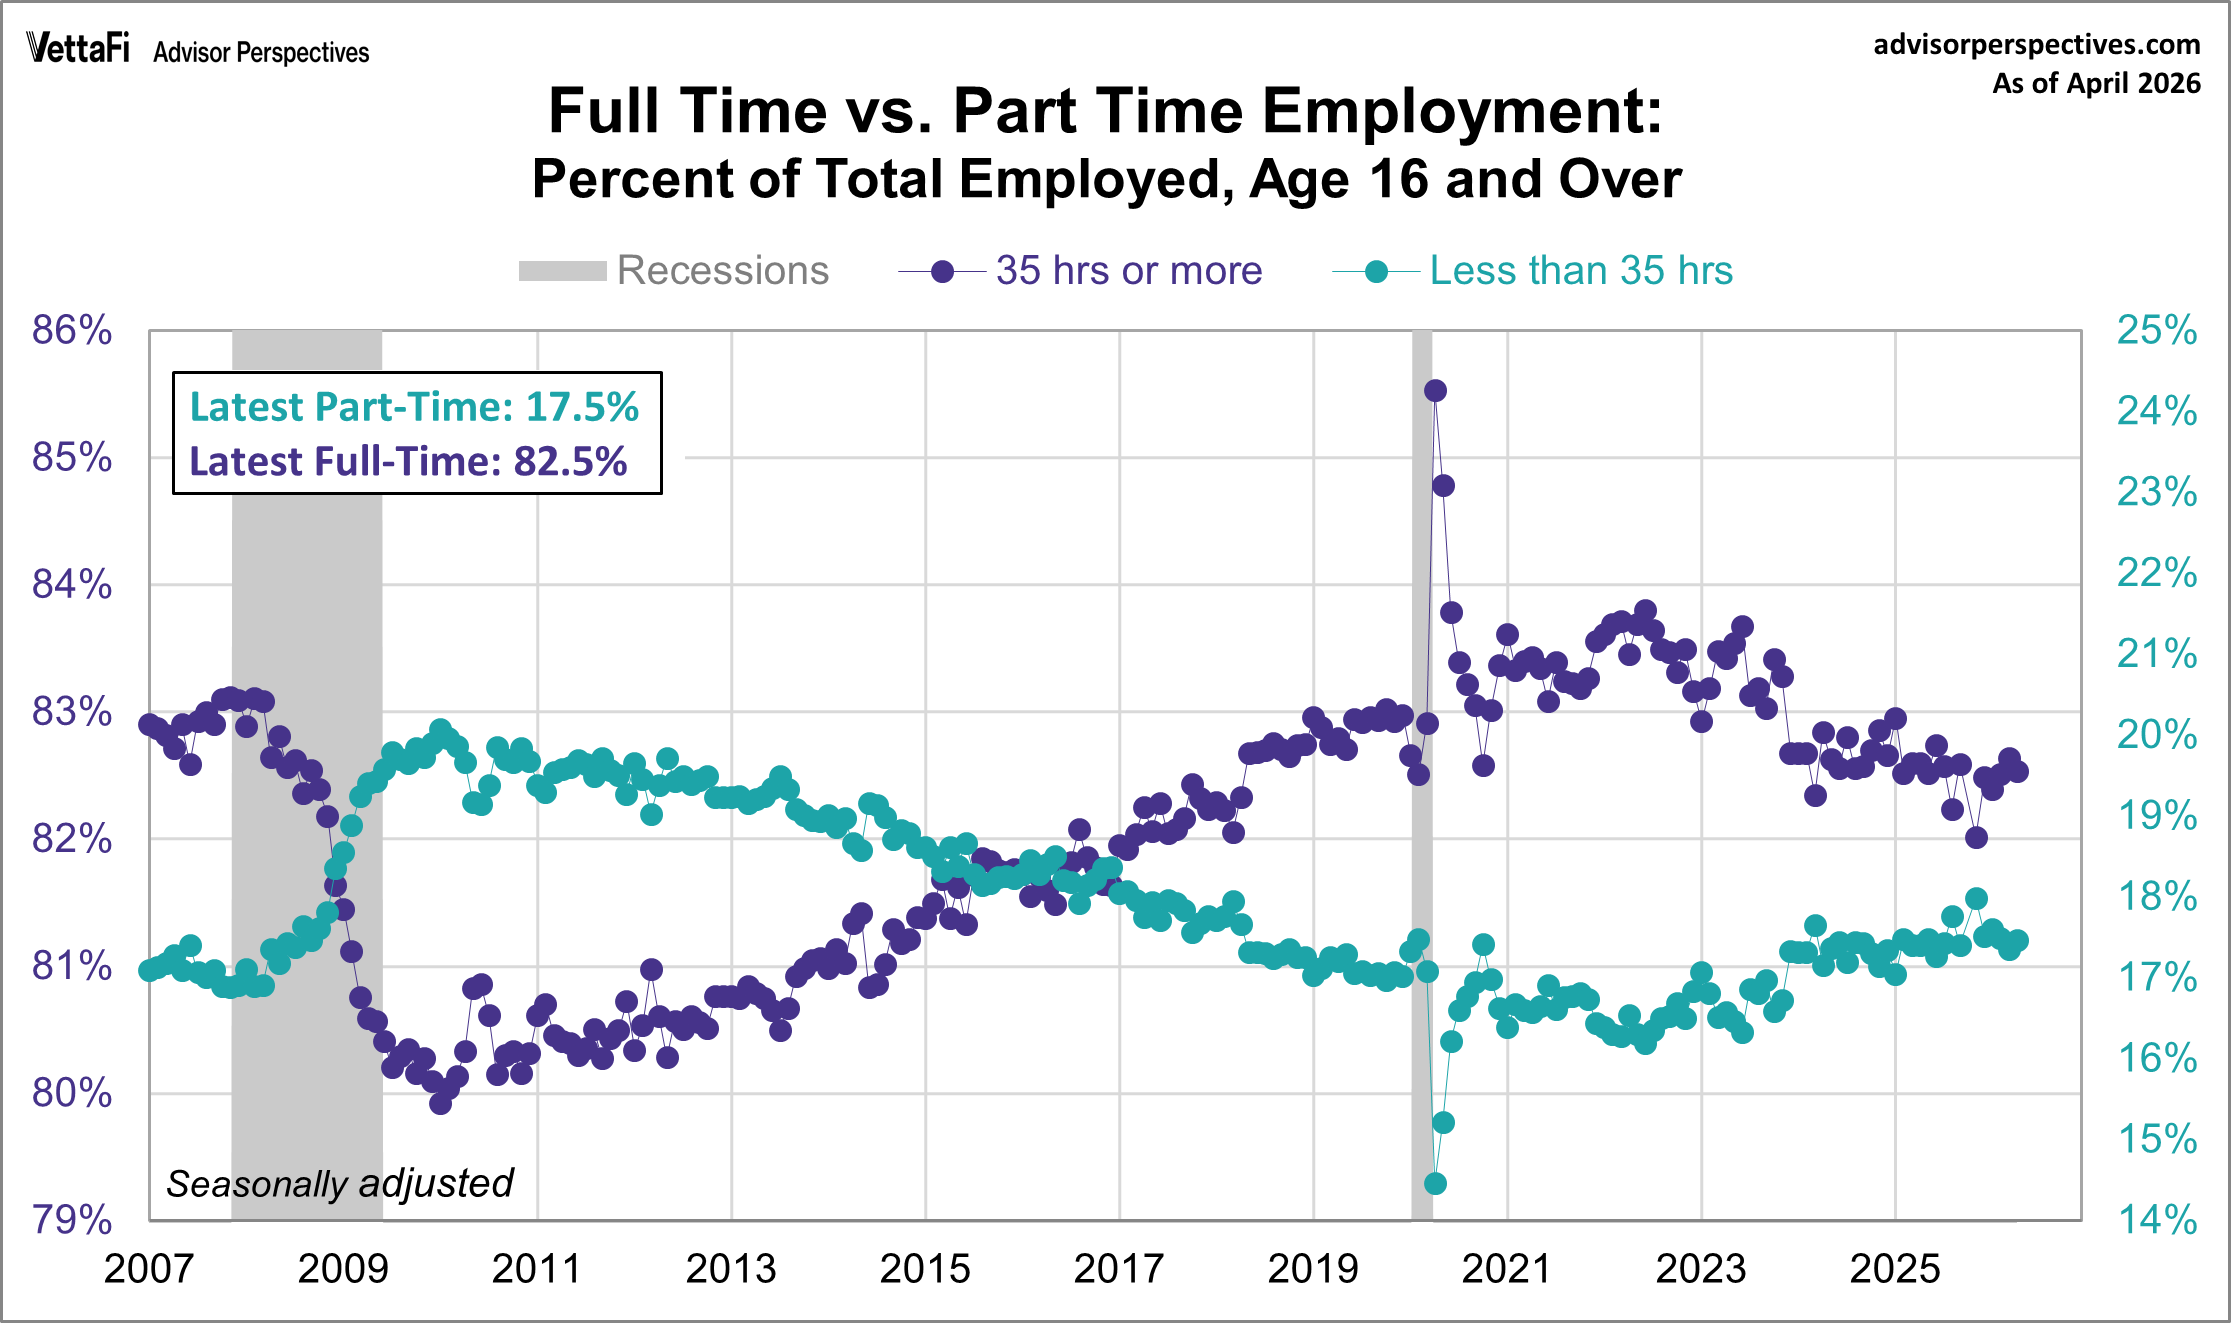
April's employment report showed that 17.5% of total employed workers were part time and 82.5% of total employed workers were full-time.
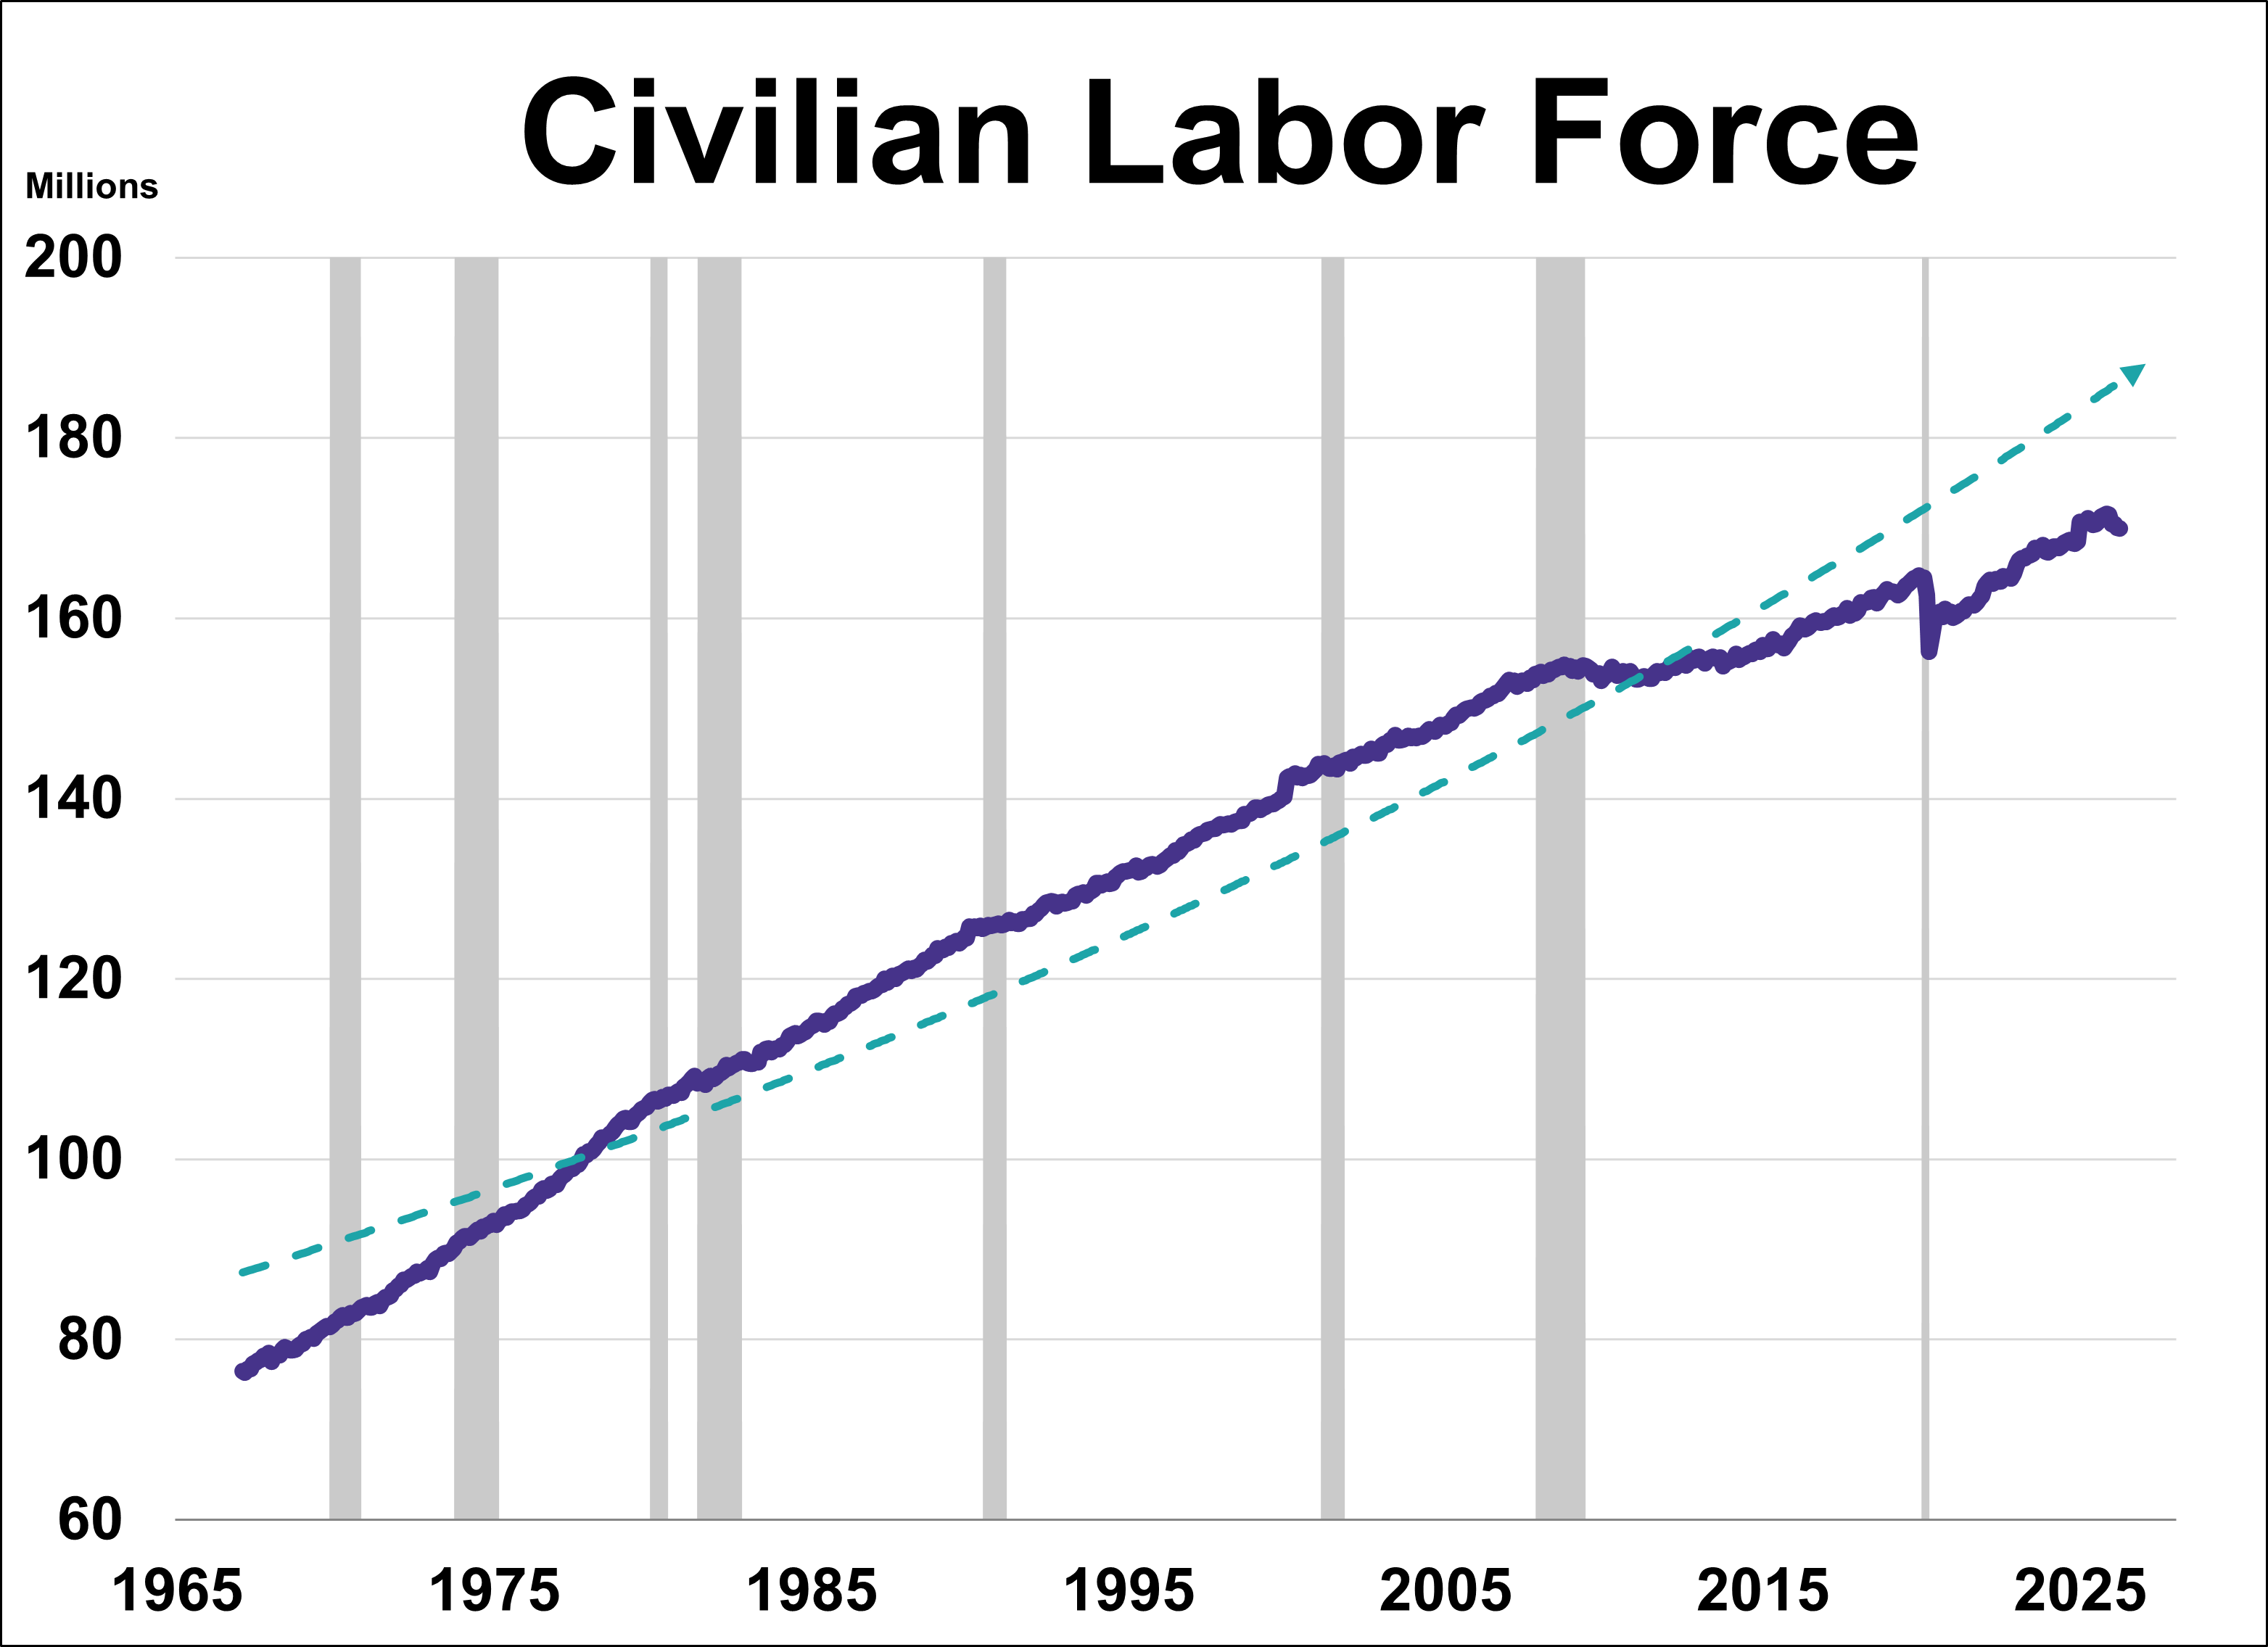
What does the ratio of unemployment claims to the civilian labor force tell us about where we are in the business cycle and recession risk?
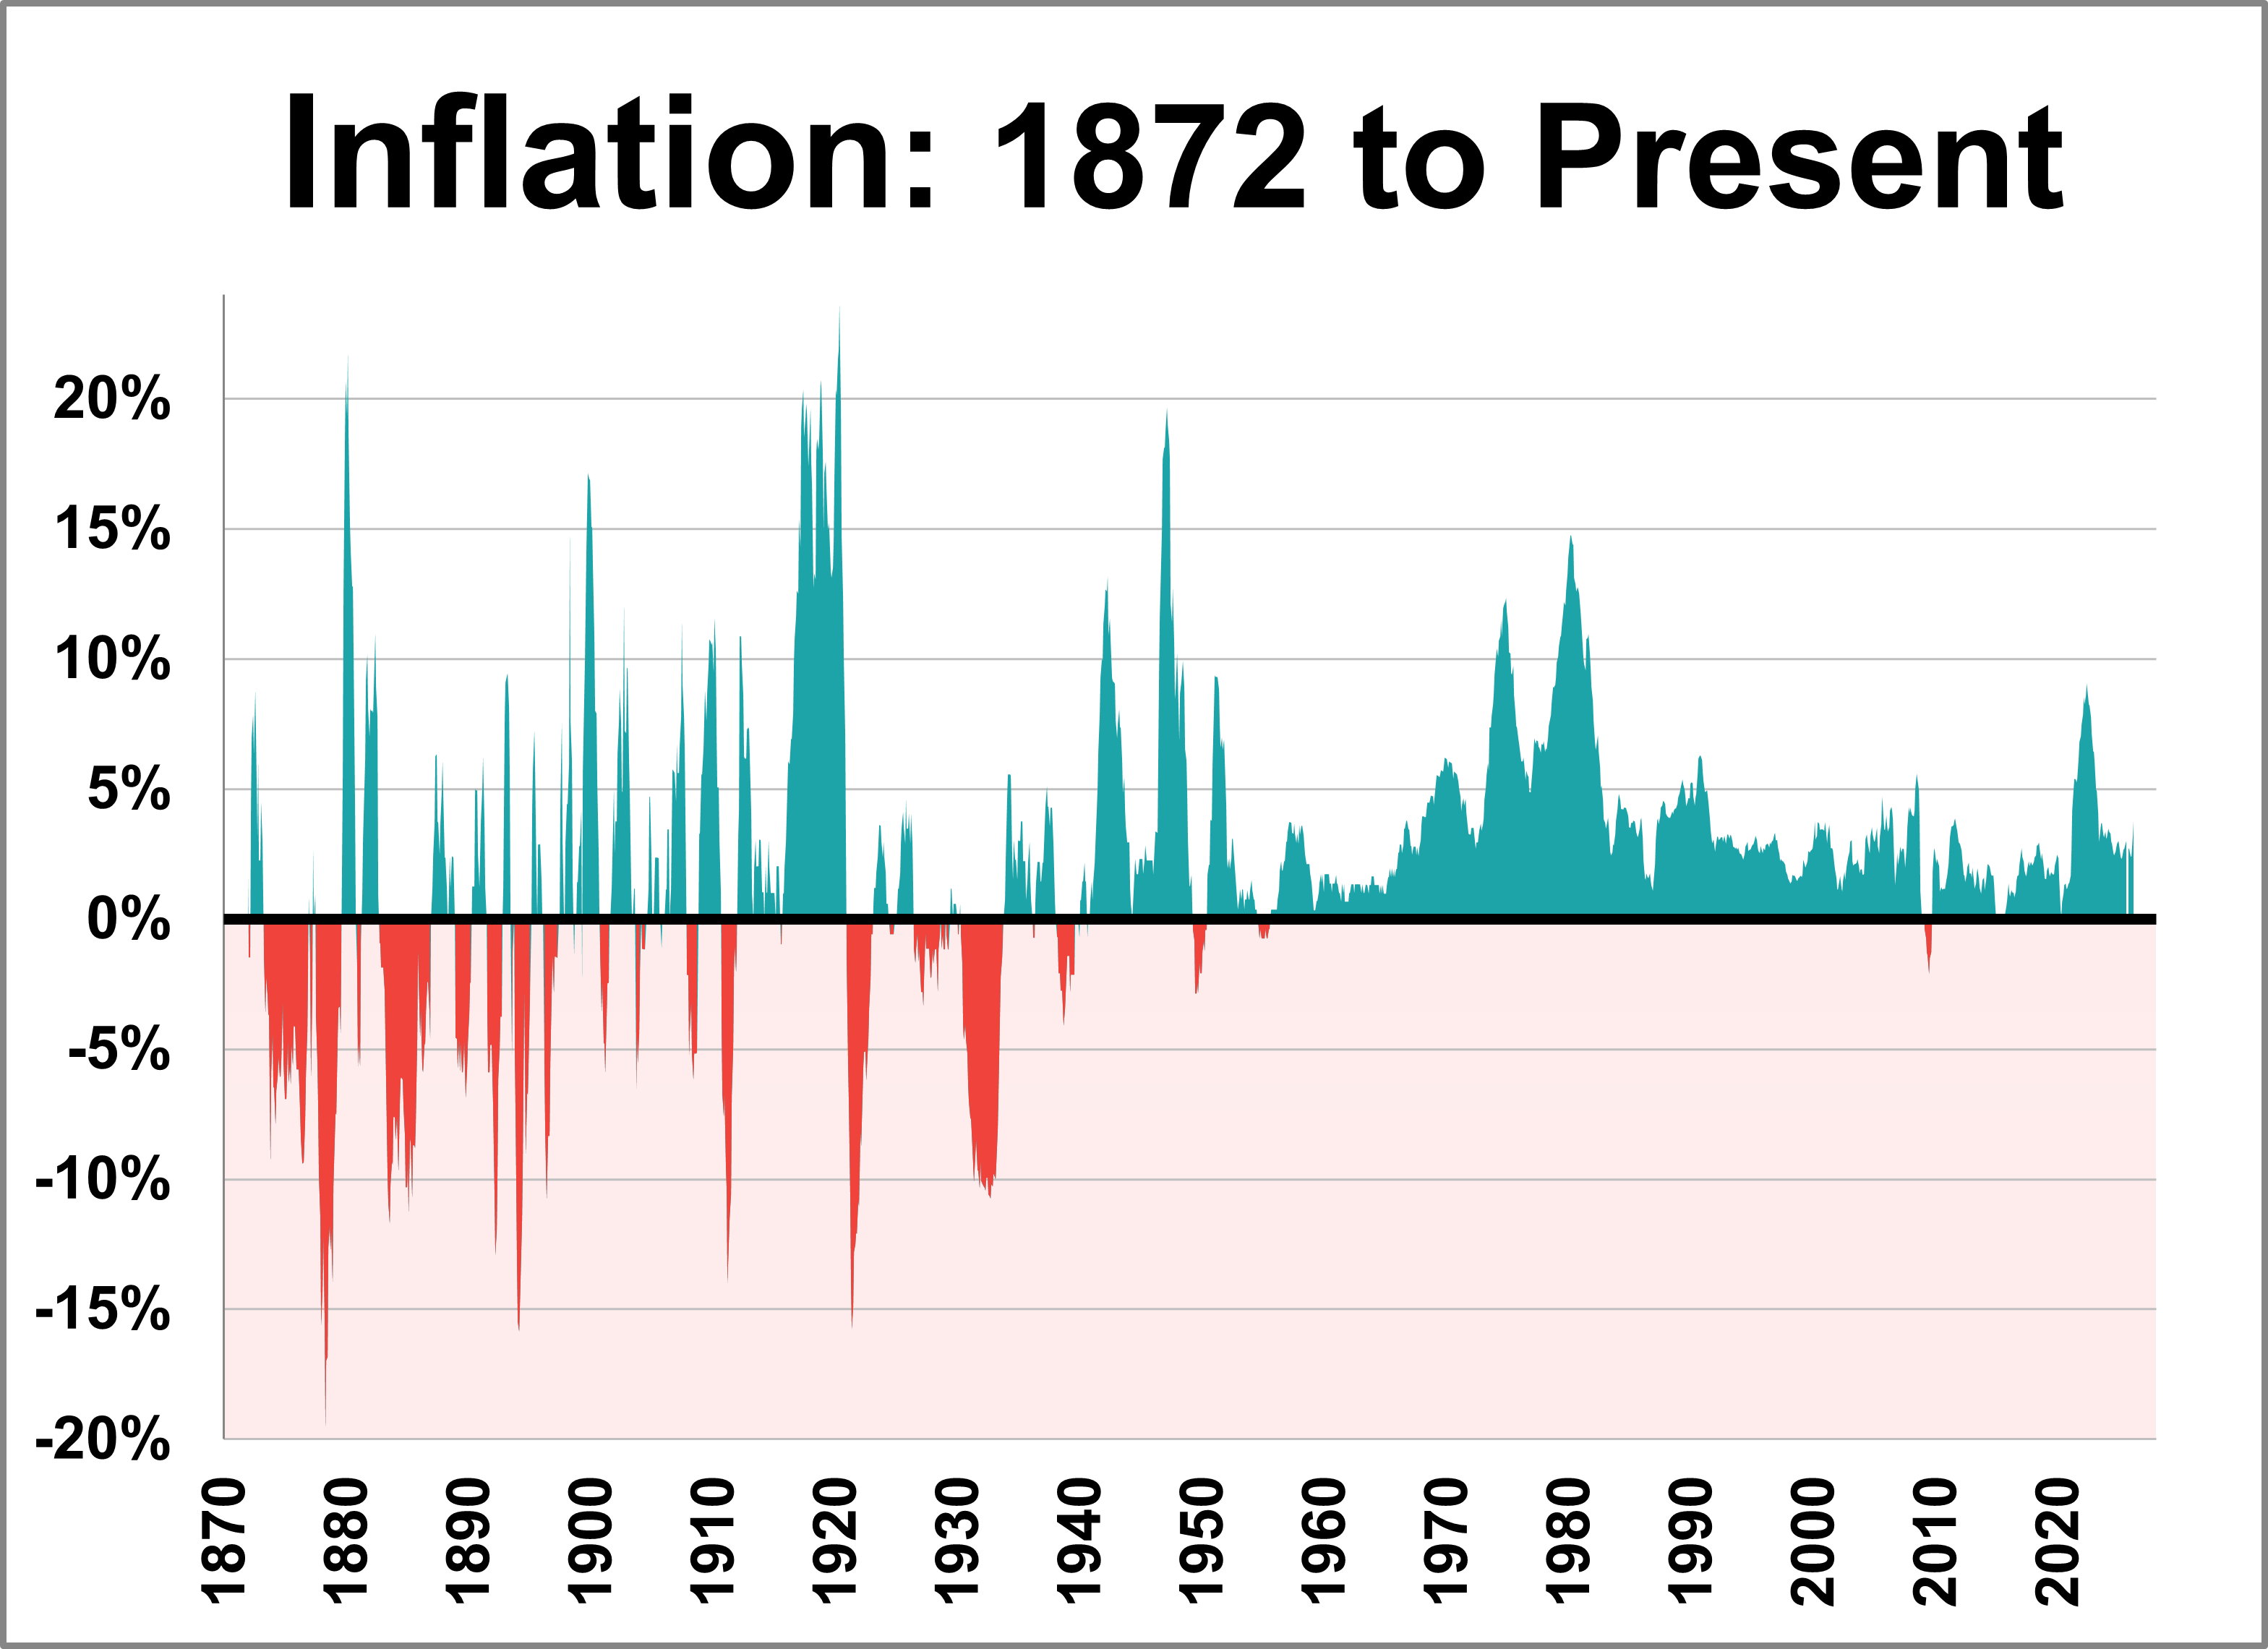
The April release of the Consumer Price Index for Urban Consumers (CPI-U) places the year-over-year inflation rate at 3.81%. This marks the first time since May 2023 that inflation is above the post-WWII average of 3.72% and the second consecutive month that the current rate has dipped below the 10-year moving average, which currently sits at 3.24%.
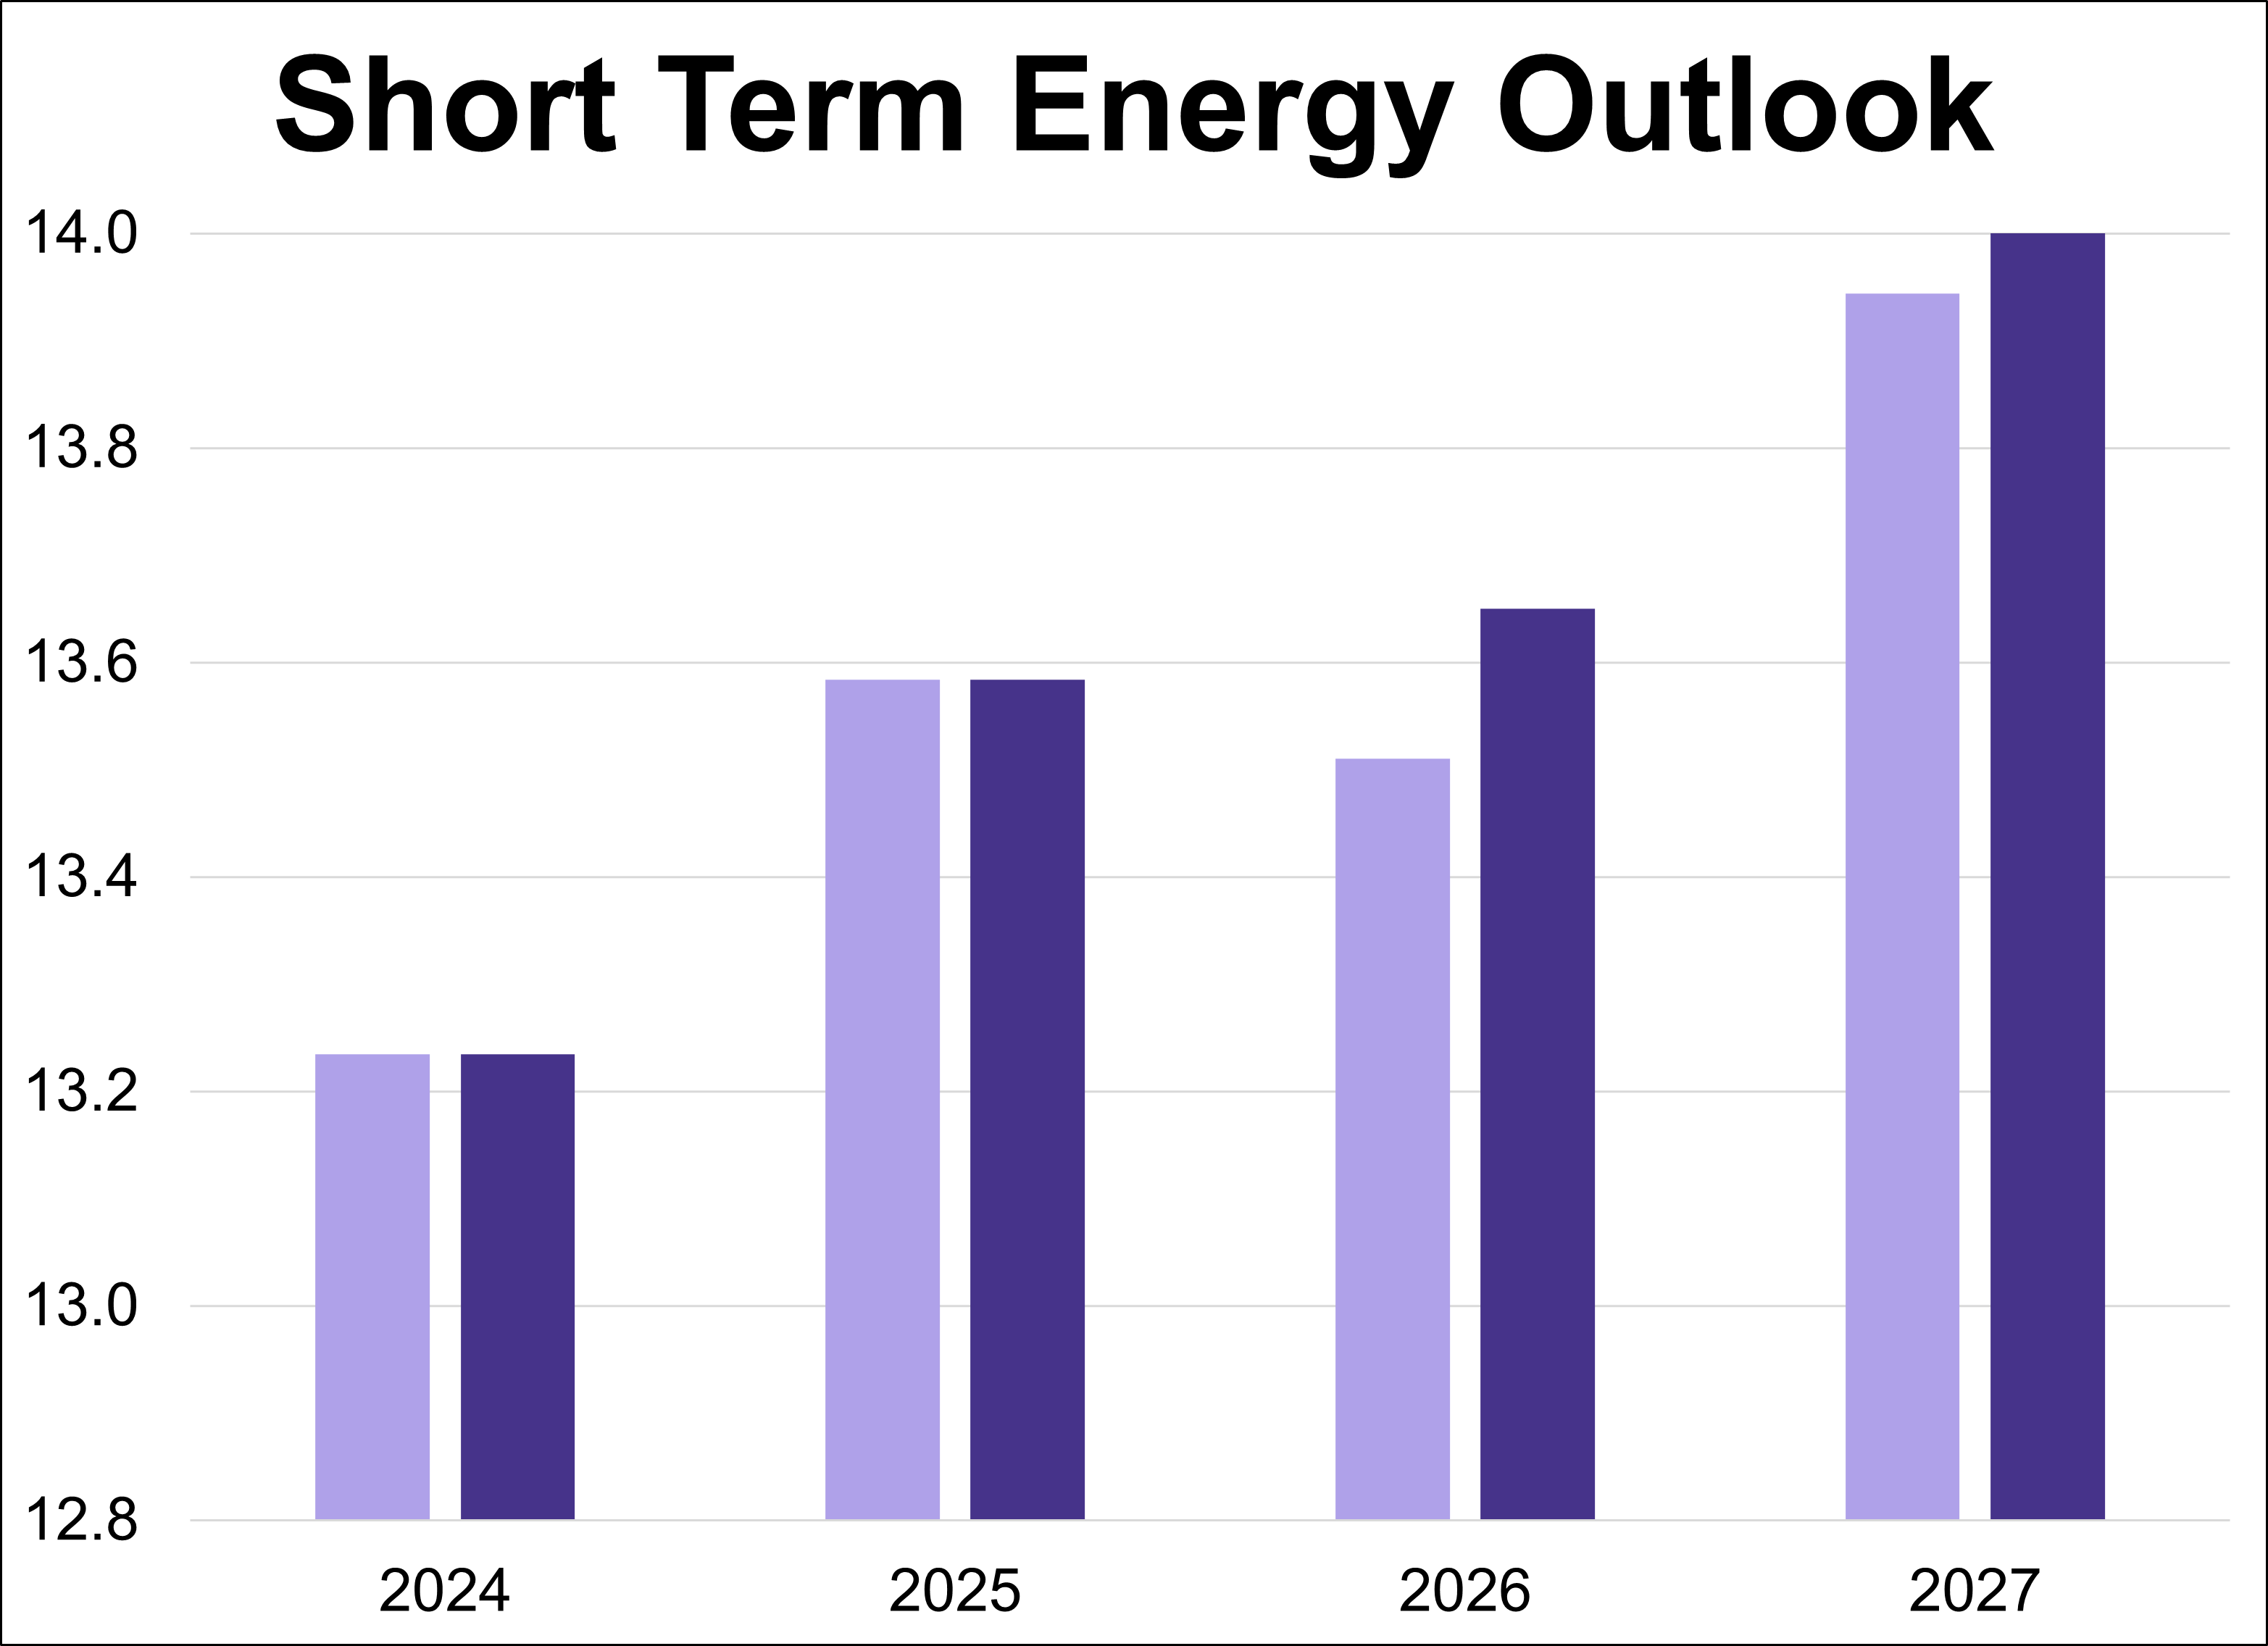
The U.S. Energy Information Administration (EIA) has released its latest Short-Term Energy Outlook (STEO), providing forecasts for energy markets. This article presents the annual production outlooks for crude oil, natural gas, and natural gas liquids (NGLs), comparing the May 2026 projections against the previous month's estimates.
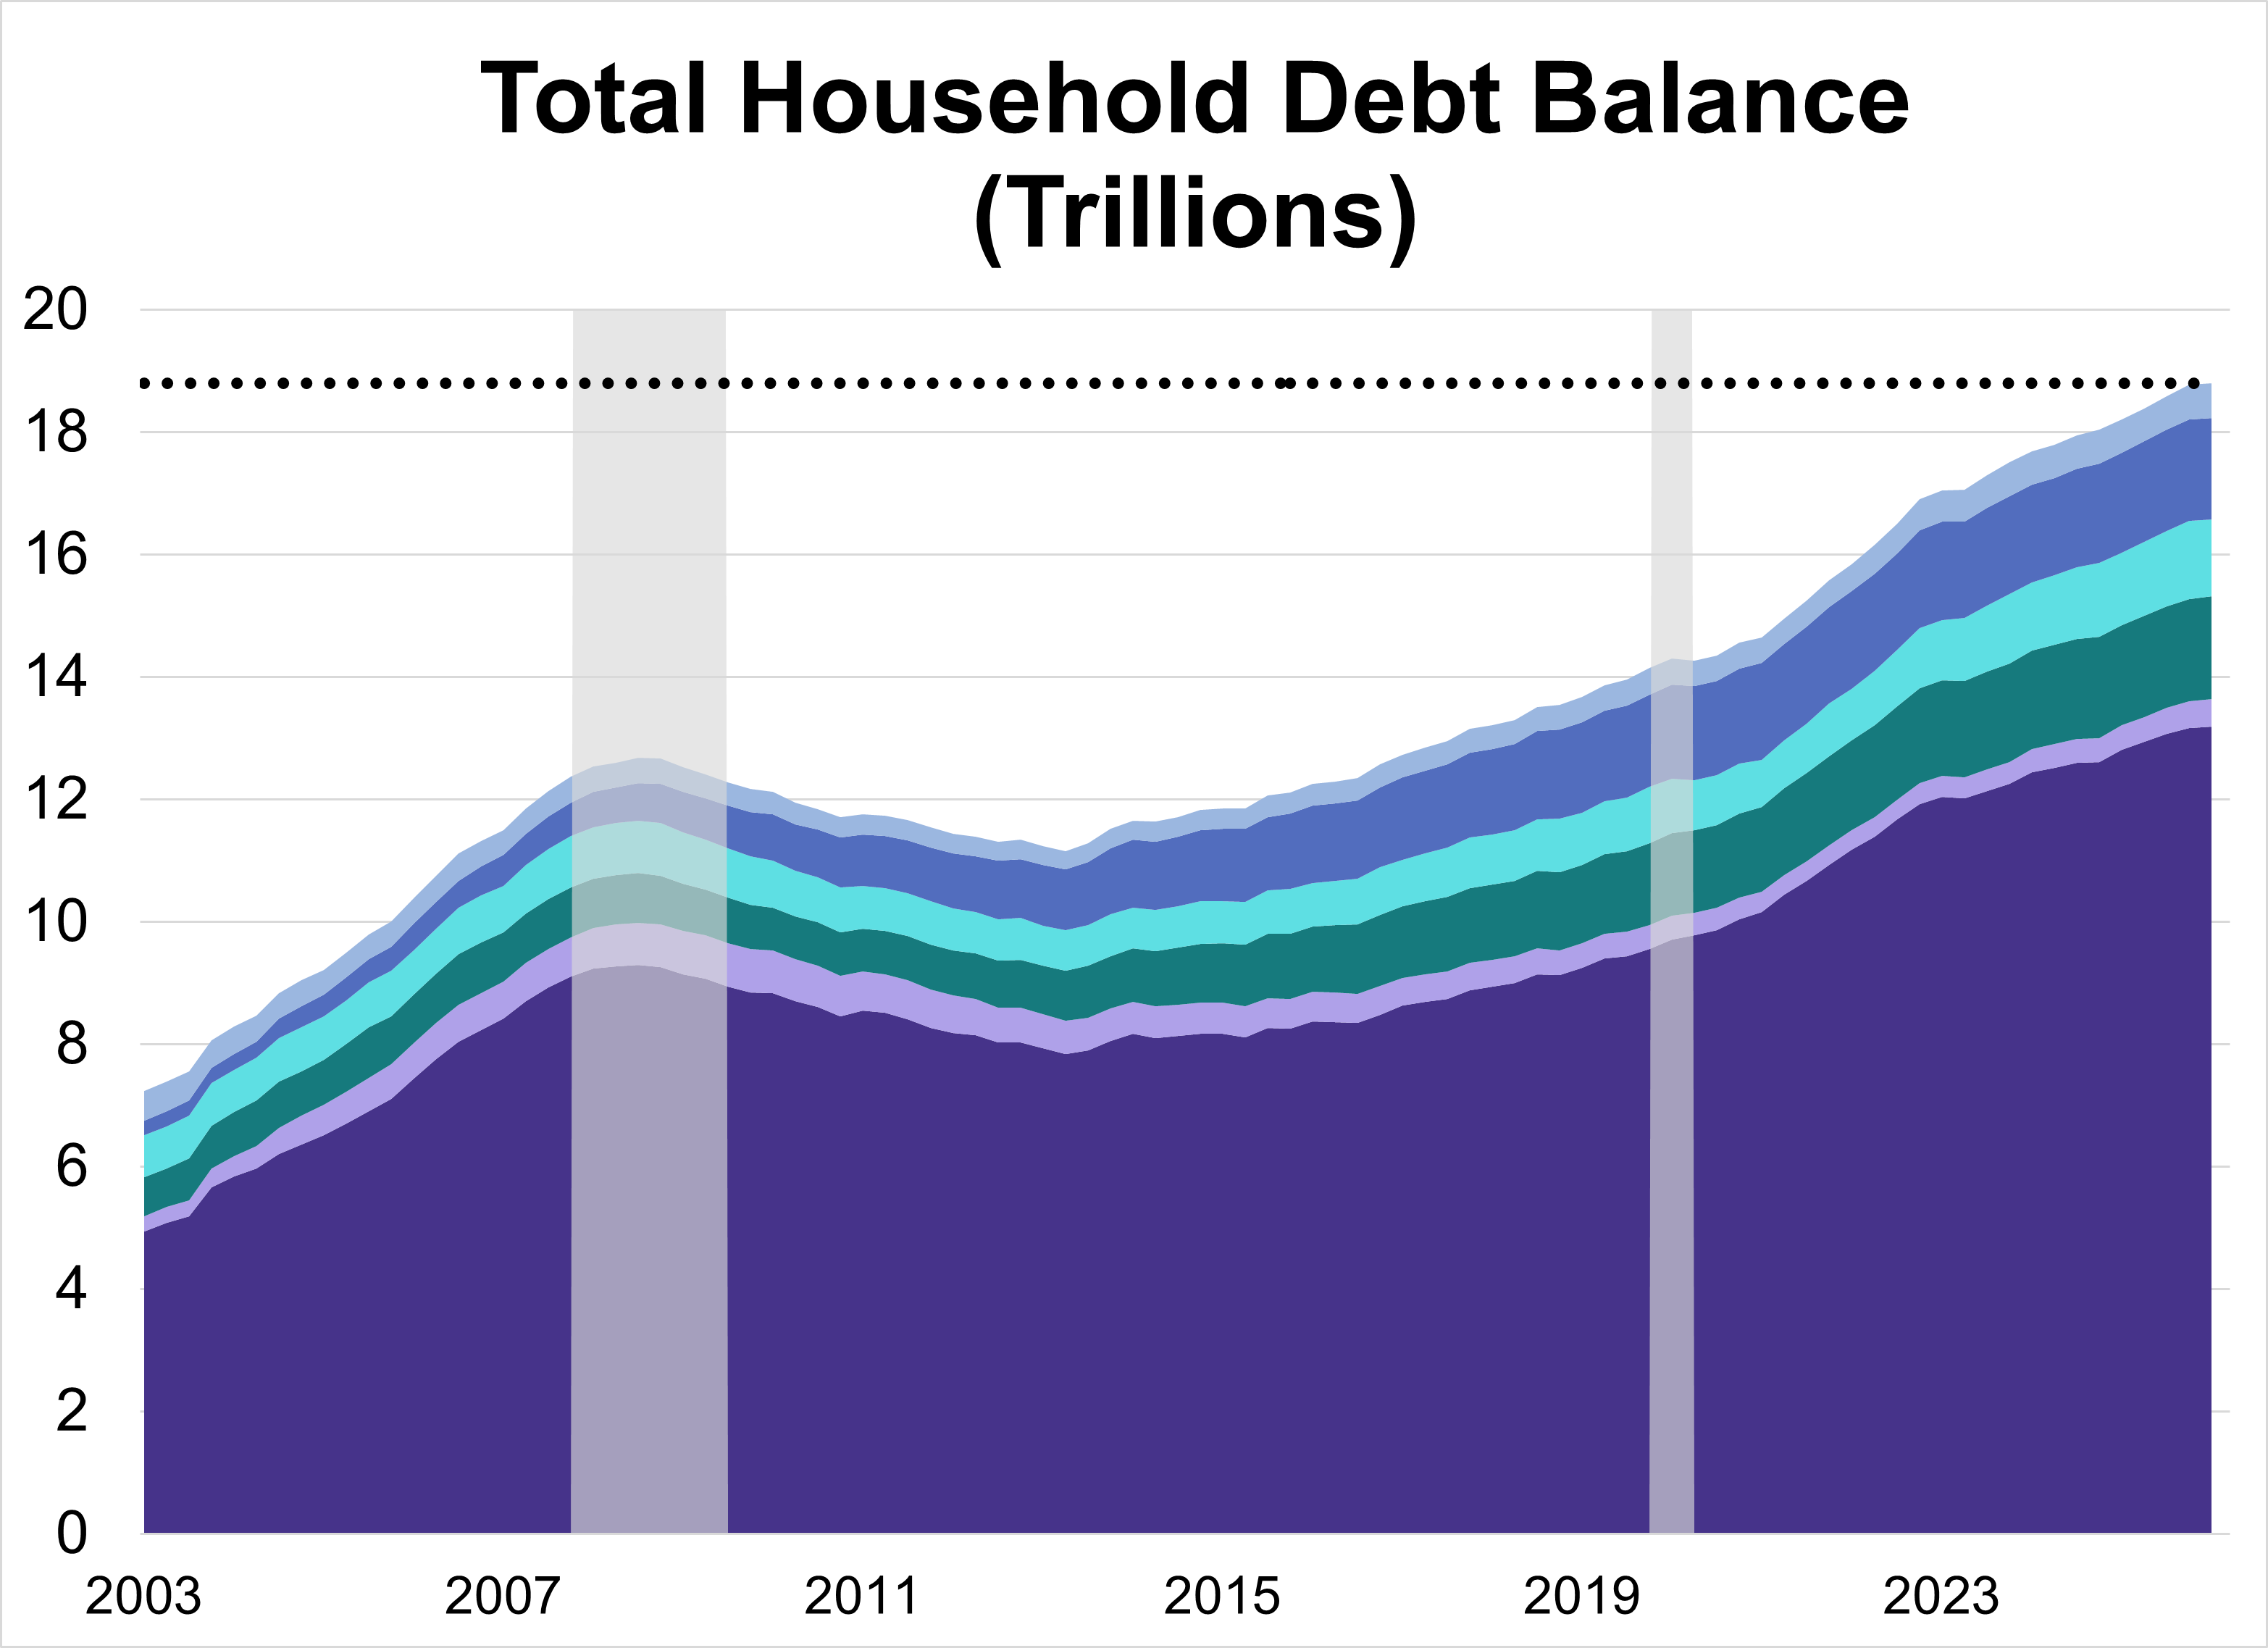
Total U.S. household debt climbed to a record $18.79 trillion in Q1 2026, a modest 0.1% ($18 billion) increase from the previous quarter. The overall rise was driven by increases across a handful of categories, specifically mortgage and auto loan balances.
Inflation affects everything from grocery bills to rent, making the Consumer Price Index (CPI) one of the most closely watched economic indicators. The Bureau of Labor Statistics (BLS) tracks this by categorizing spending into eight categories, each weighted by its relative importance.