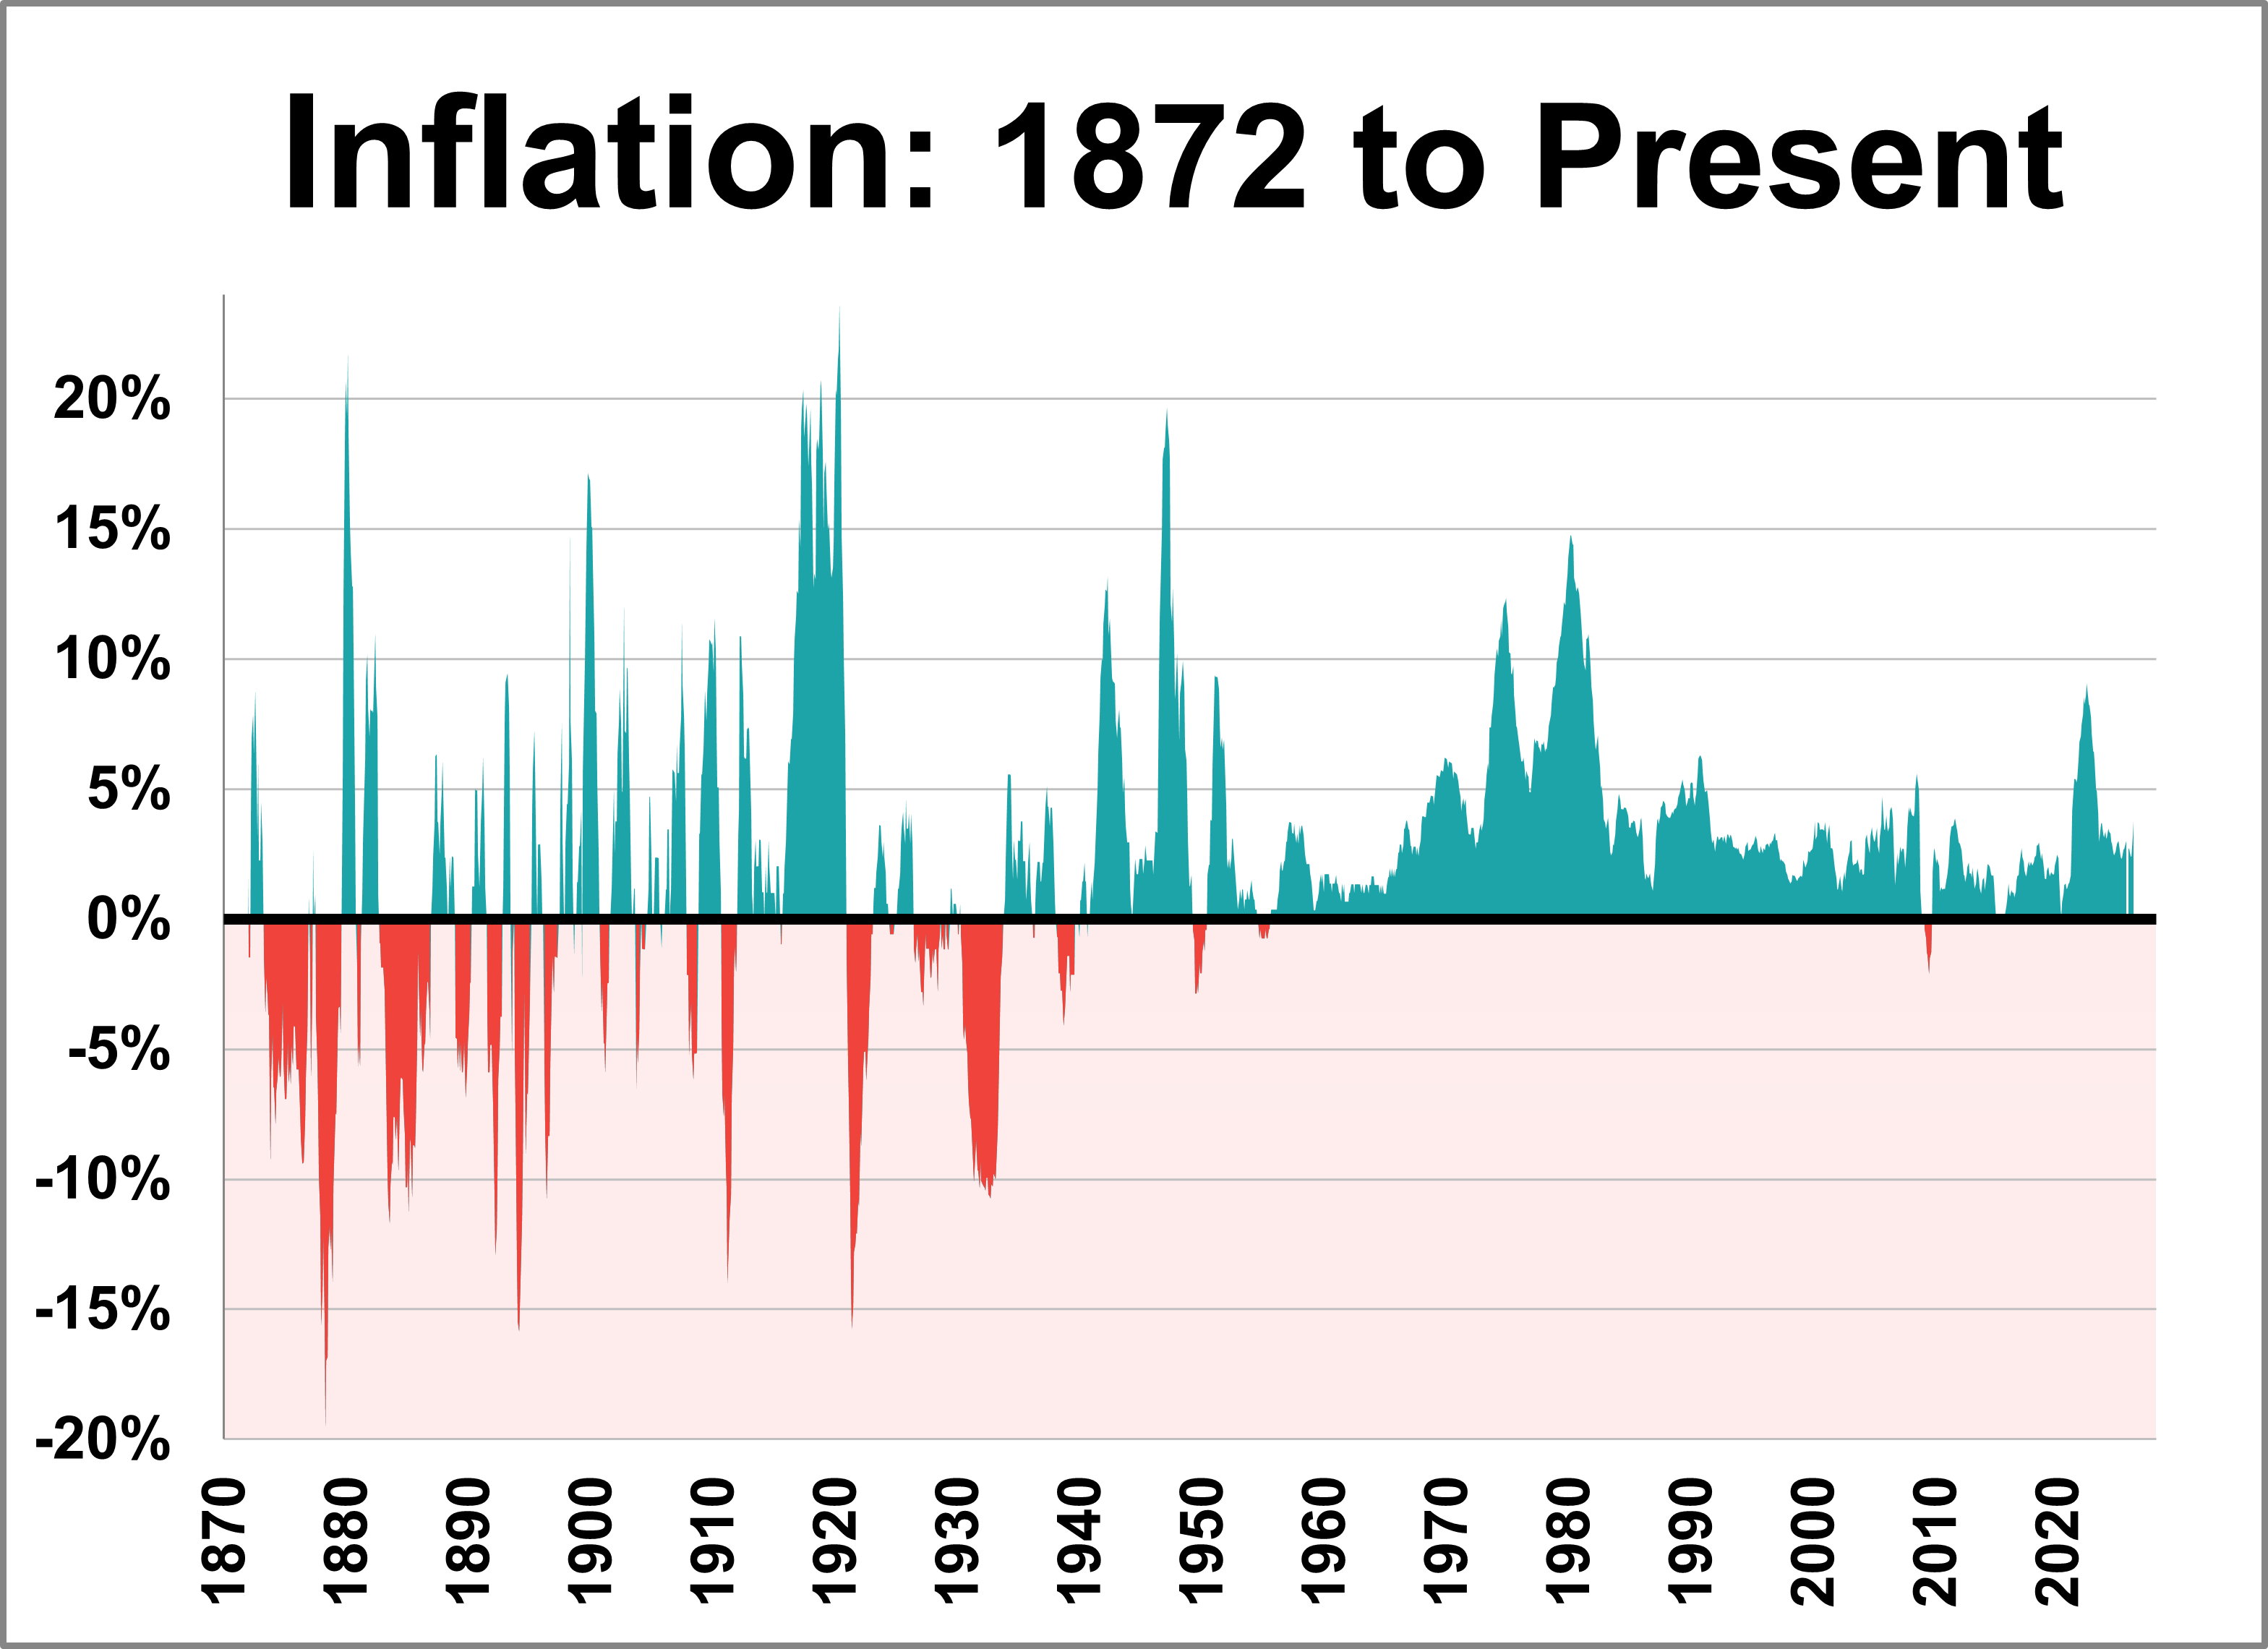
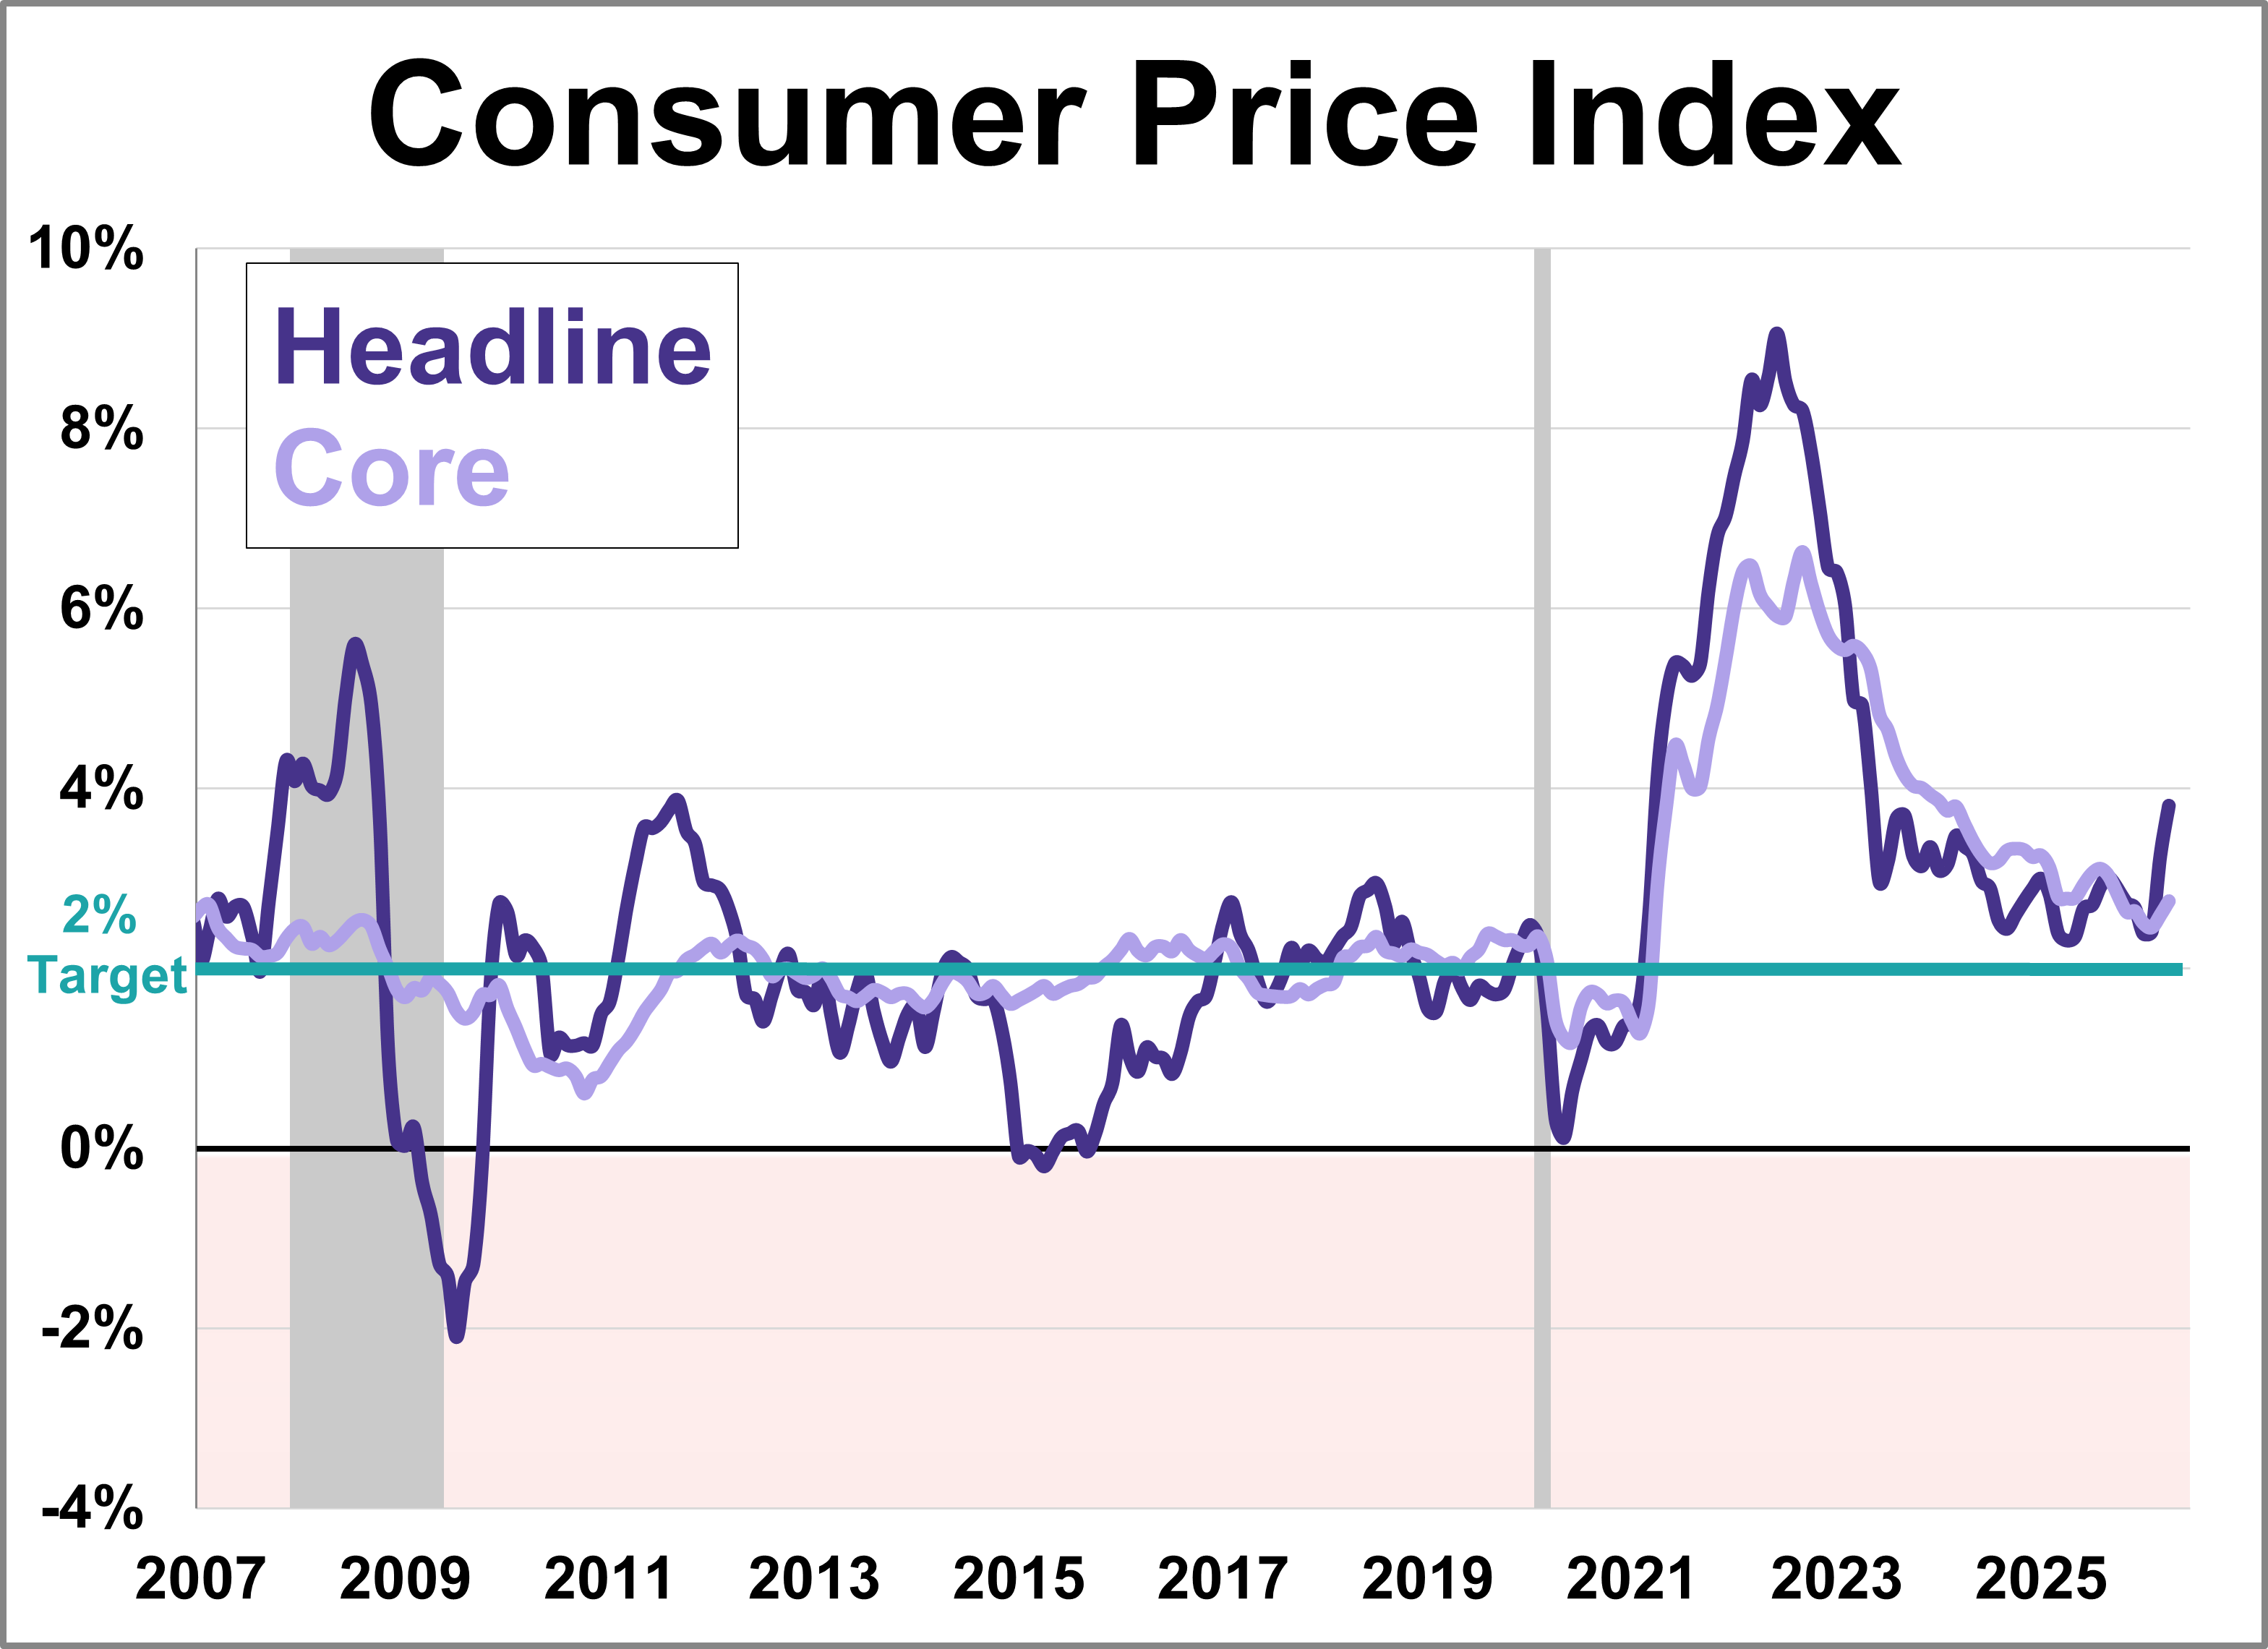
The April release of the Consumer Price Index for Urban Consumers (CPI-U) places the year-over-year inflation rate at 3.81%. This marks the first time since May 2023 that inflation is above the post-WWII average of 3.72% and the second consecutive month that the current rate has dipped below the 10-year moving average, which currently sits at 3.24%.
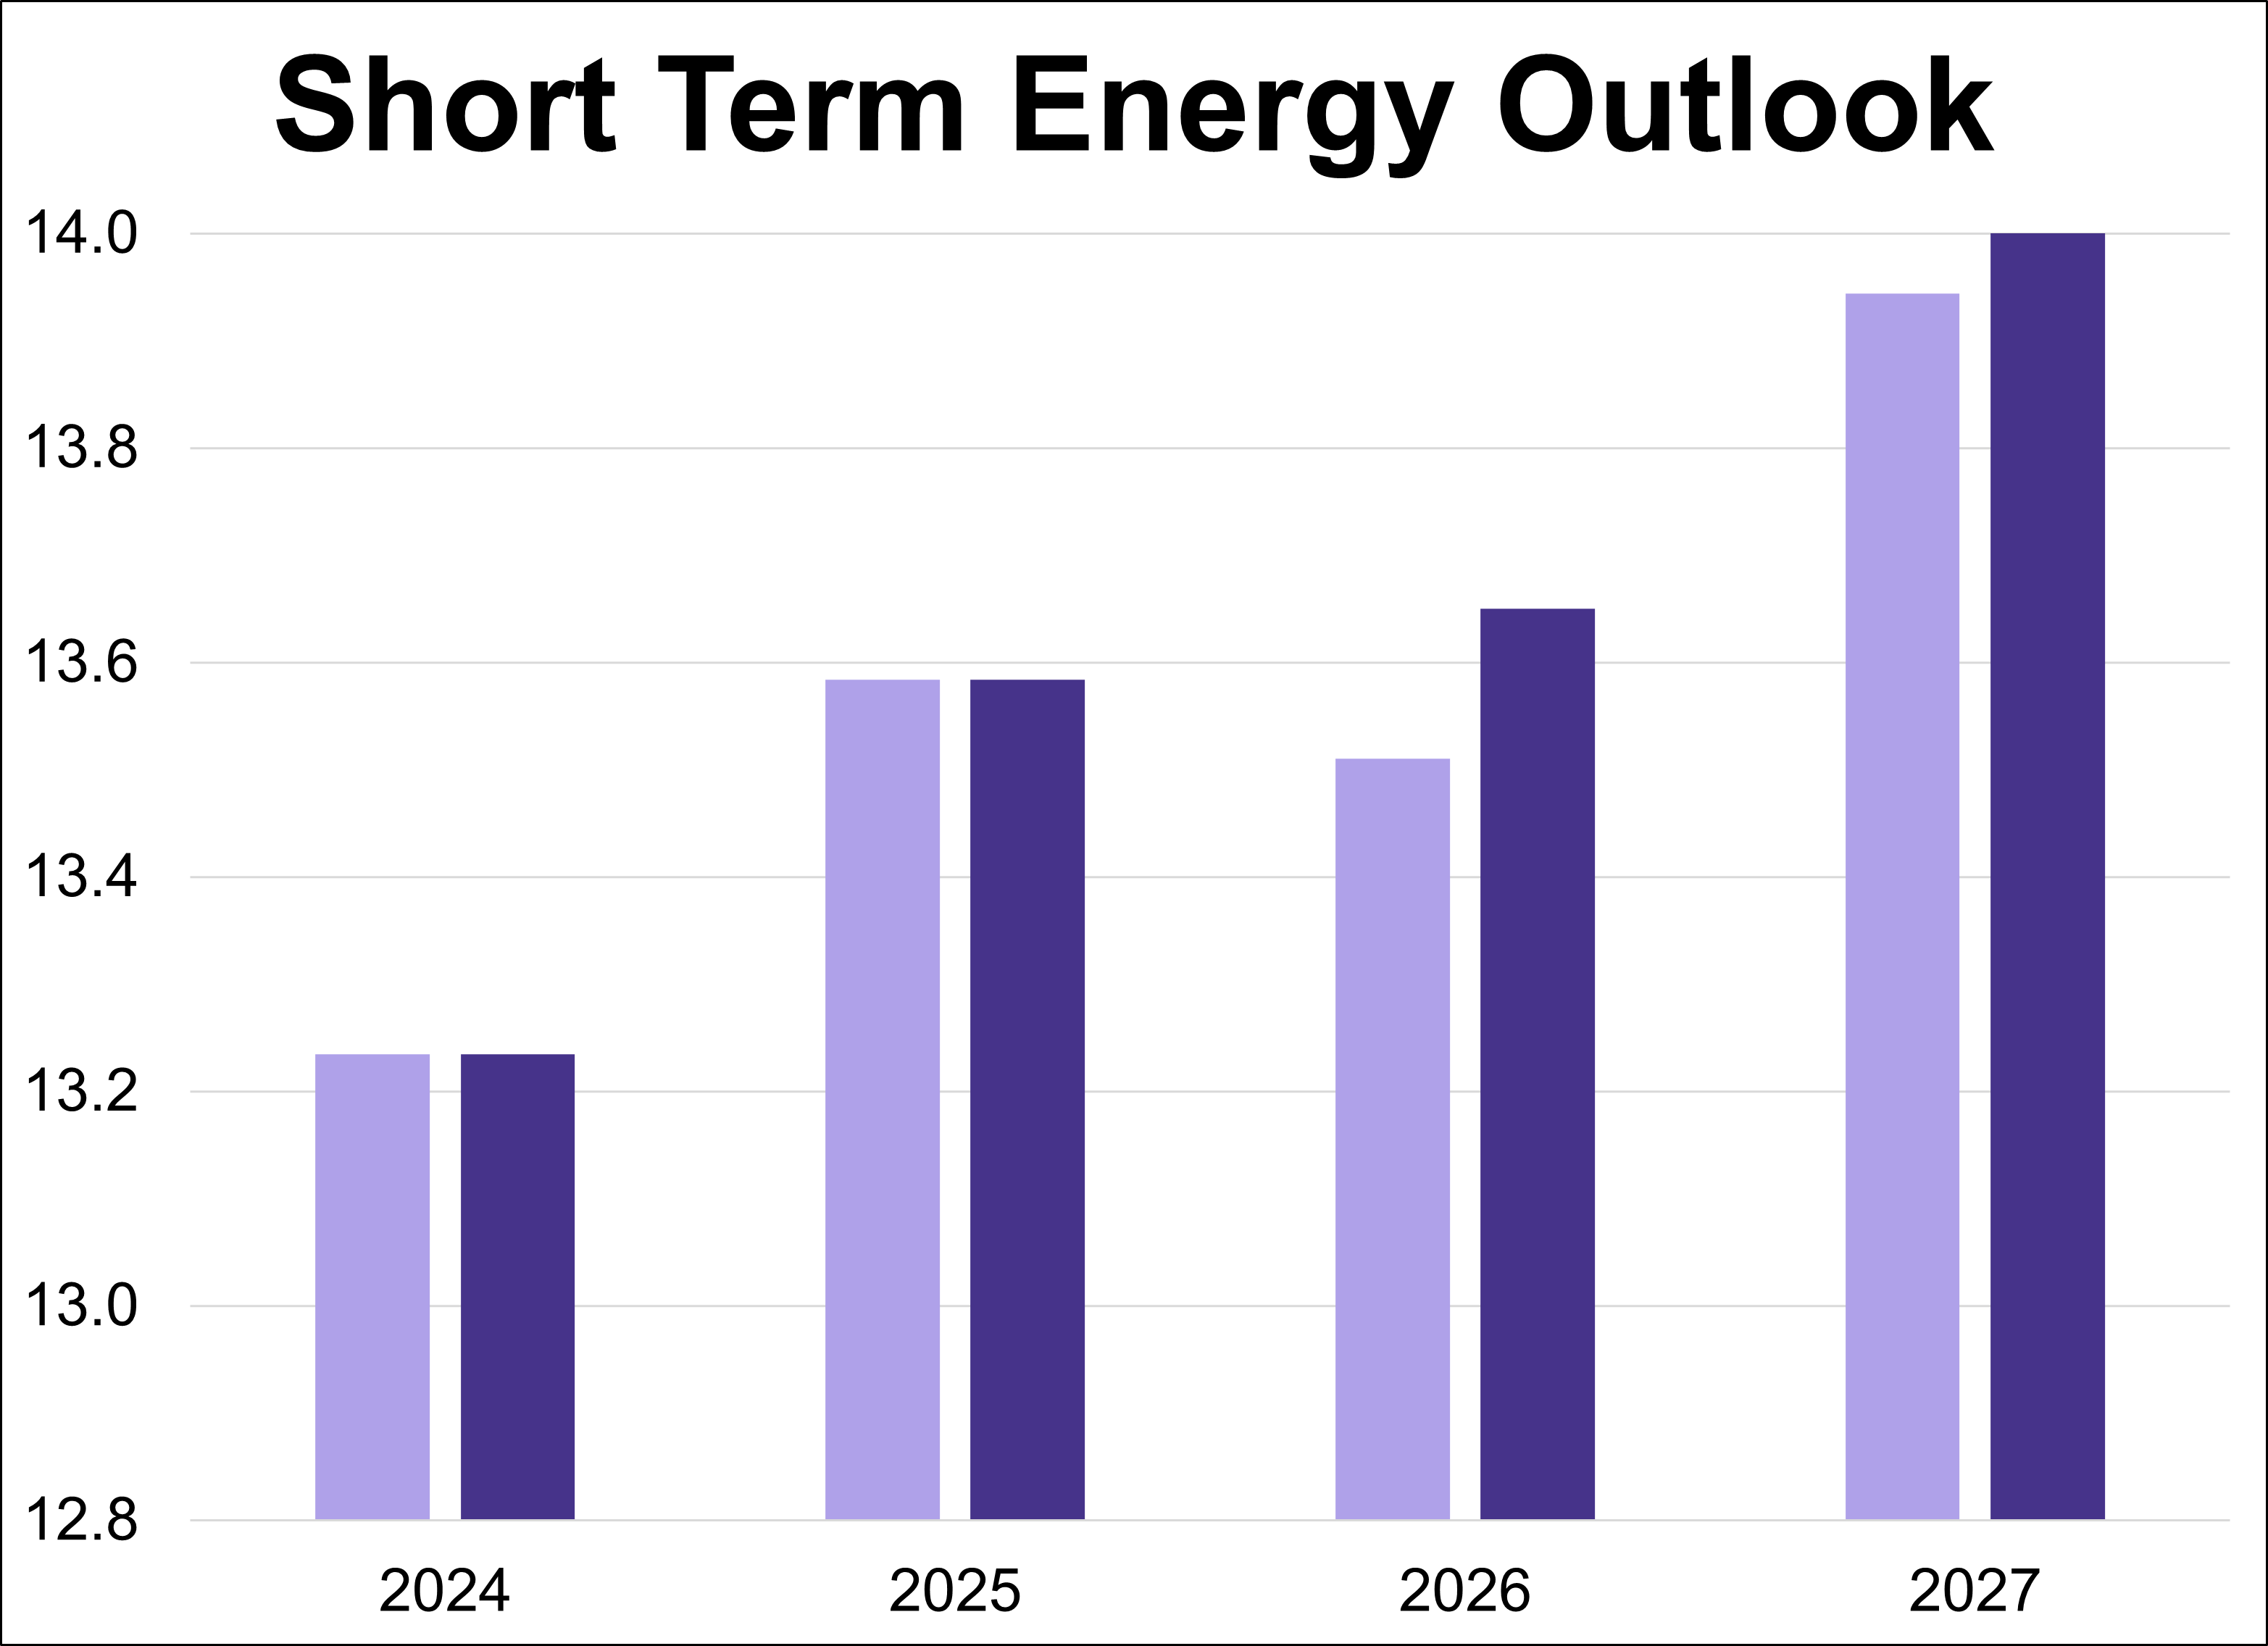
The U.S. Energy Information Administration (EIA) has released its latest Short-Term Energy Outlook (STEO), providing forecasts for energy markets. This article presents the annual production outlooks for crude oil, natural gas, and natural gas liquids (NGLs), comparing the May 2026 projections against the previous month's estimates.
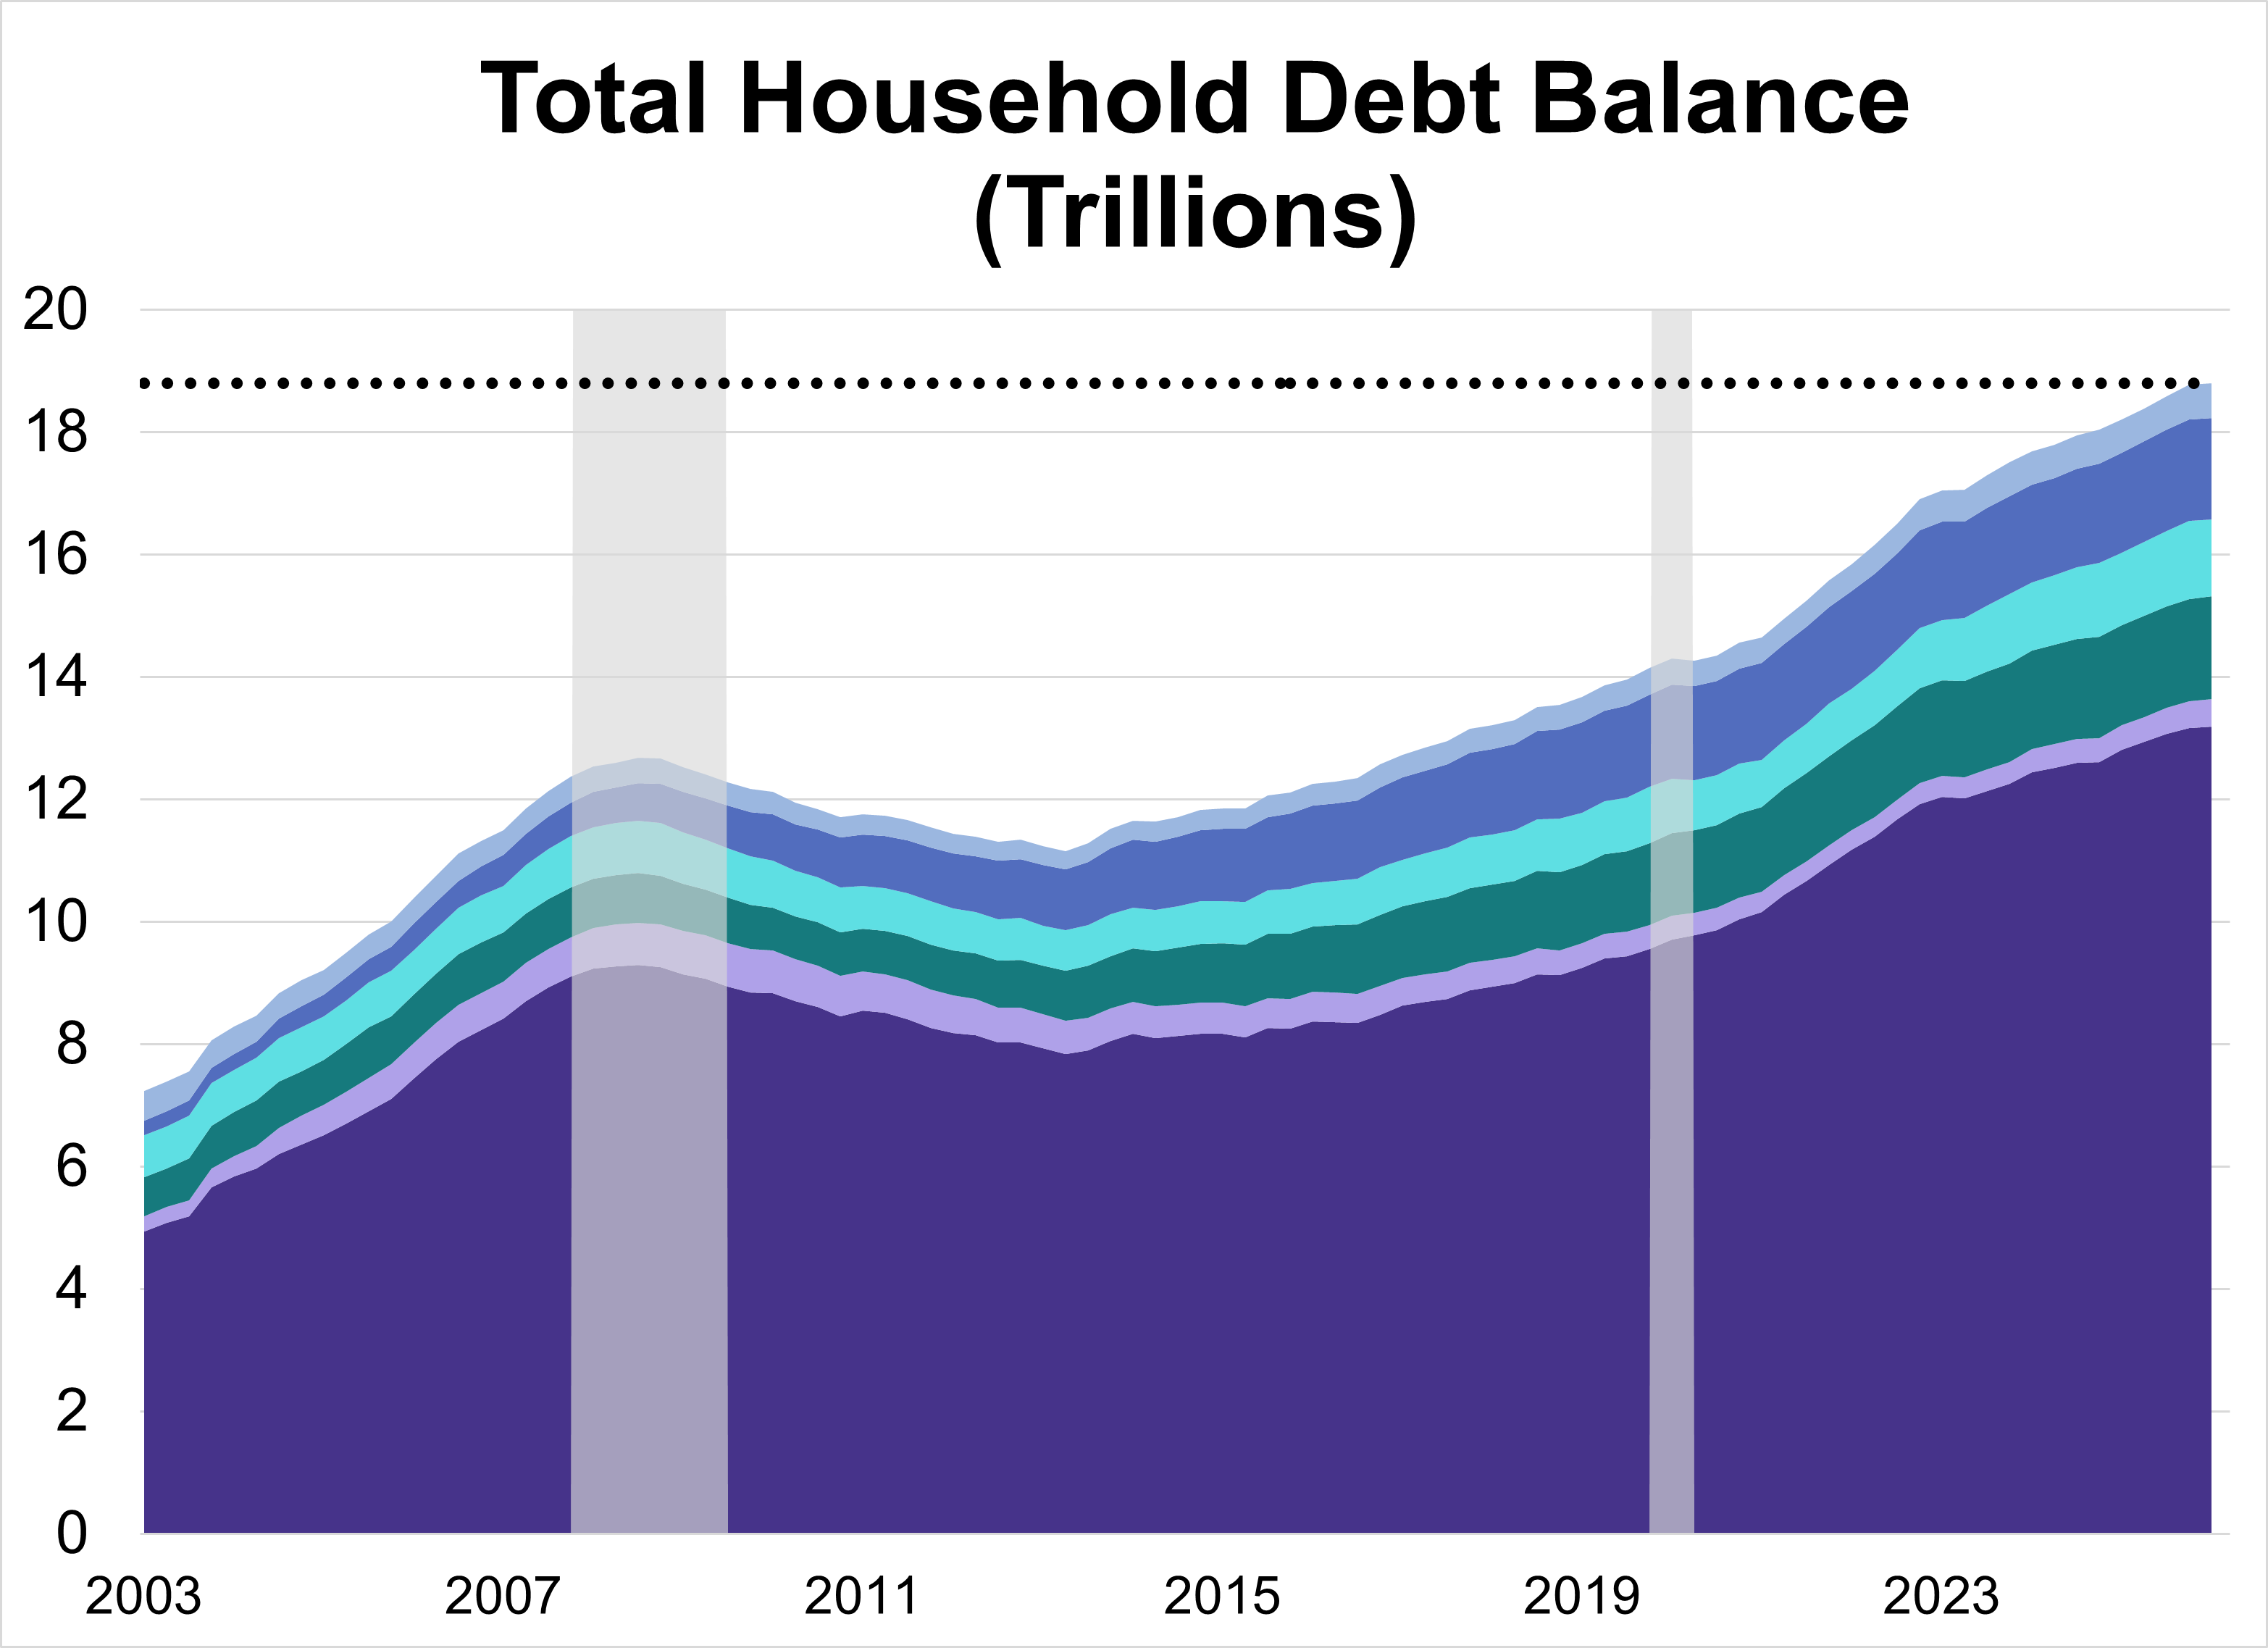
Total U.S. household debt climbed to a record $18.79 trillion in Q1 2026, a modest 0.1% ($18 billion) increase from the previous quarter. The overall rise was driven by increases across a handful of categories, specifically mortgage and auto loan balances.
Inflation affects everything from grocery bills to rent, making the Consumer Price Index (CPI) one of the most closely watched economic indicators. The Bureau of Labor Statistics (BLS) tracks this by categorizing spending into eight categories, each weighted by its relative importance.
This series has been updated to include the March release of the consumer price index as the deflator and the monthly employment update. The latest hypothetical real (inflation-adjusted) annual earnings are at $54,469, down 5.8% from over 50 years ago.
The NFIB Small Business Optimism Index inched up 0.1 points to 95.9, remaining below the index's historical average for a second straight month.
Inflation surged to 3.8% year-over-year in April, hitting its highest level in nearly three years. The headline figure for the Consumer Price Index (CPI) was slightly above the forecast of 3.7%, driven primarily by cost increases in energy, shelter, and food.
Munis may have struggled a bit in March, but the long-term environment for these bonds remains full of potential.
Explore the new 529 rules, including Roth IRA rollovers, the grandparent loophole, and higher K-12 limits.
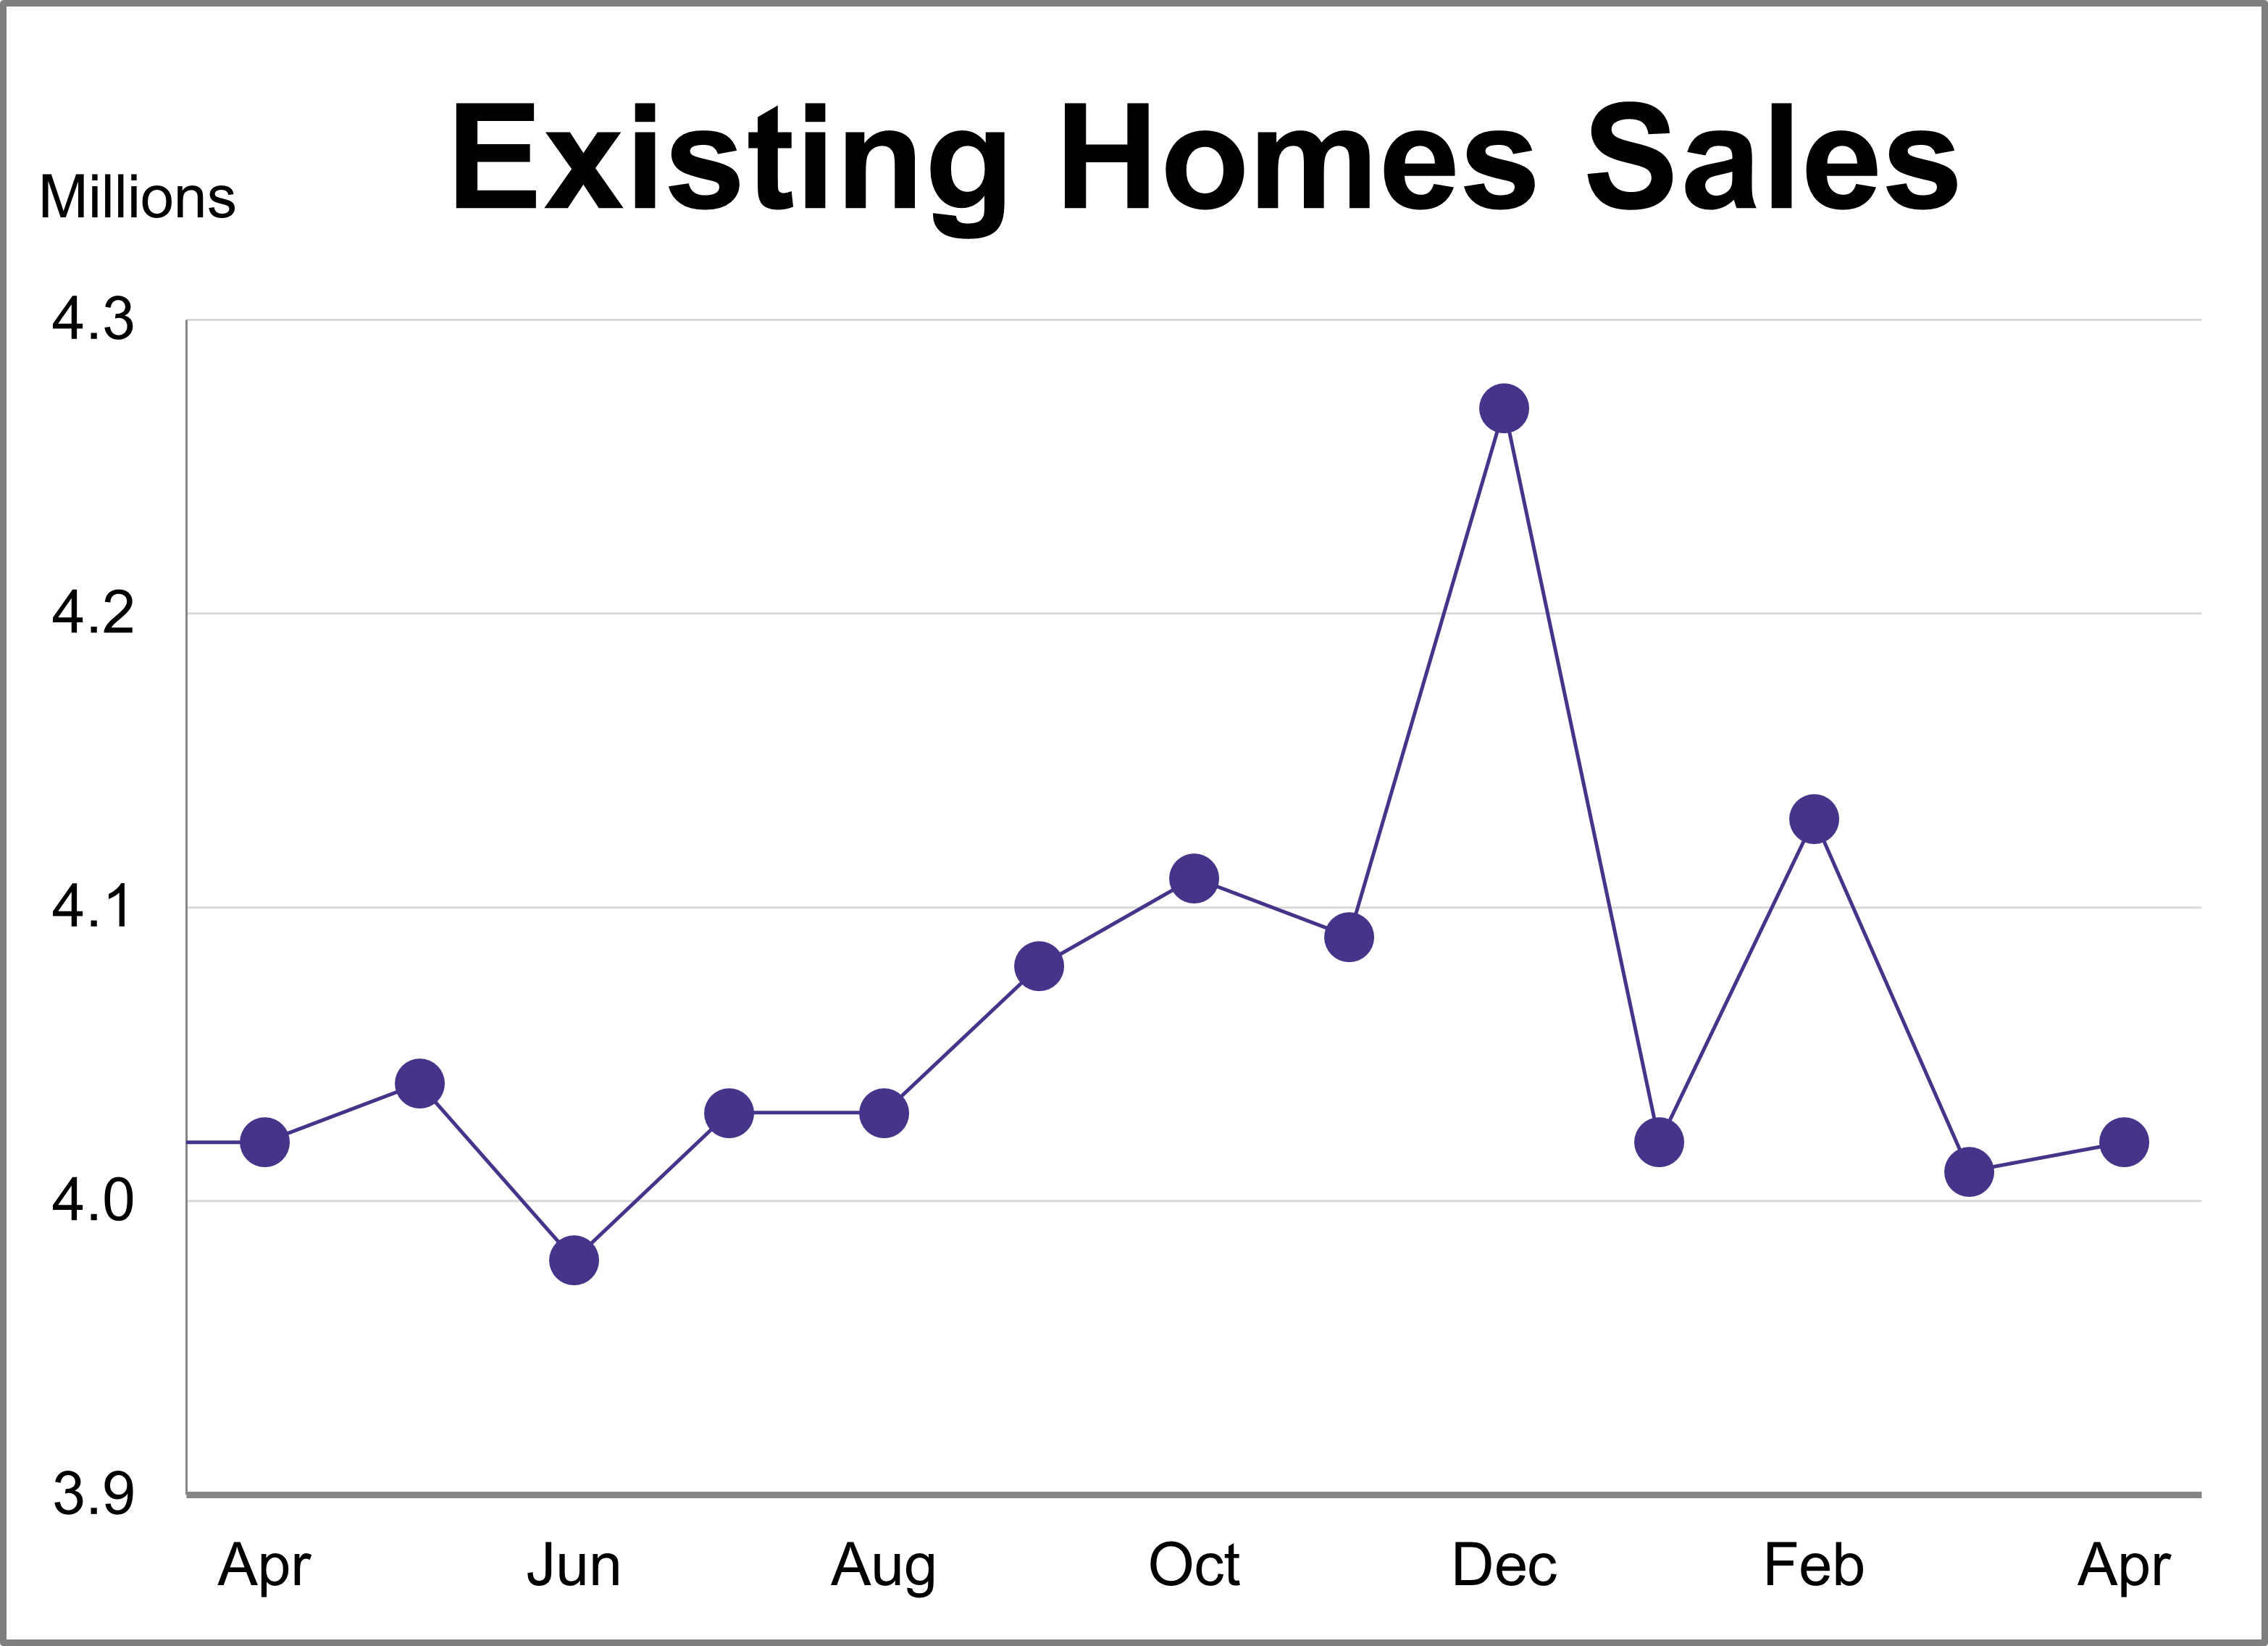
Existing home sales were modestly boosted in April, inching up 0.2% following a 2.9% decline in March. According to the National Association of Realtors (NAR), sales reached a seasonally adjusted annual rate of 4.02 million units, falling just short of the projected 4.05 million.
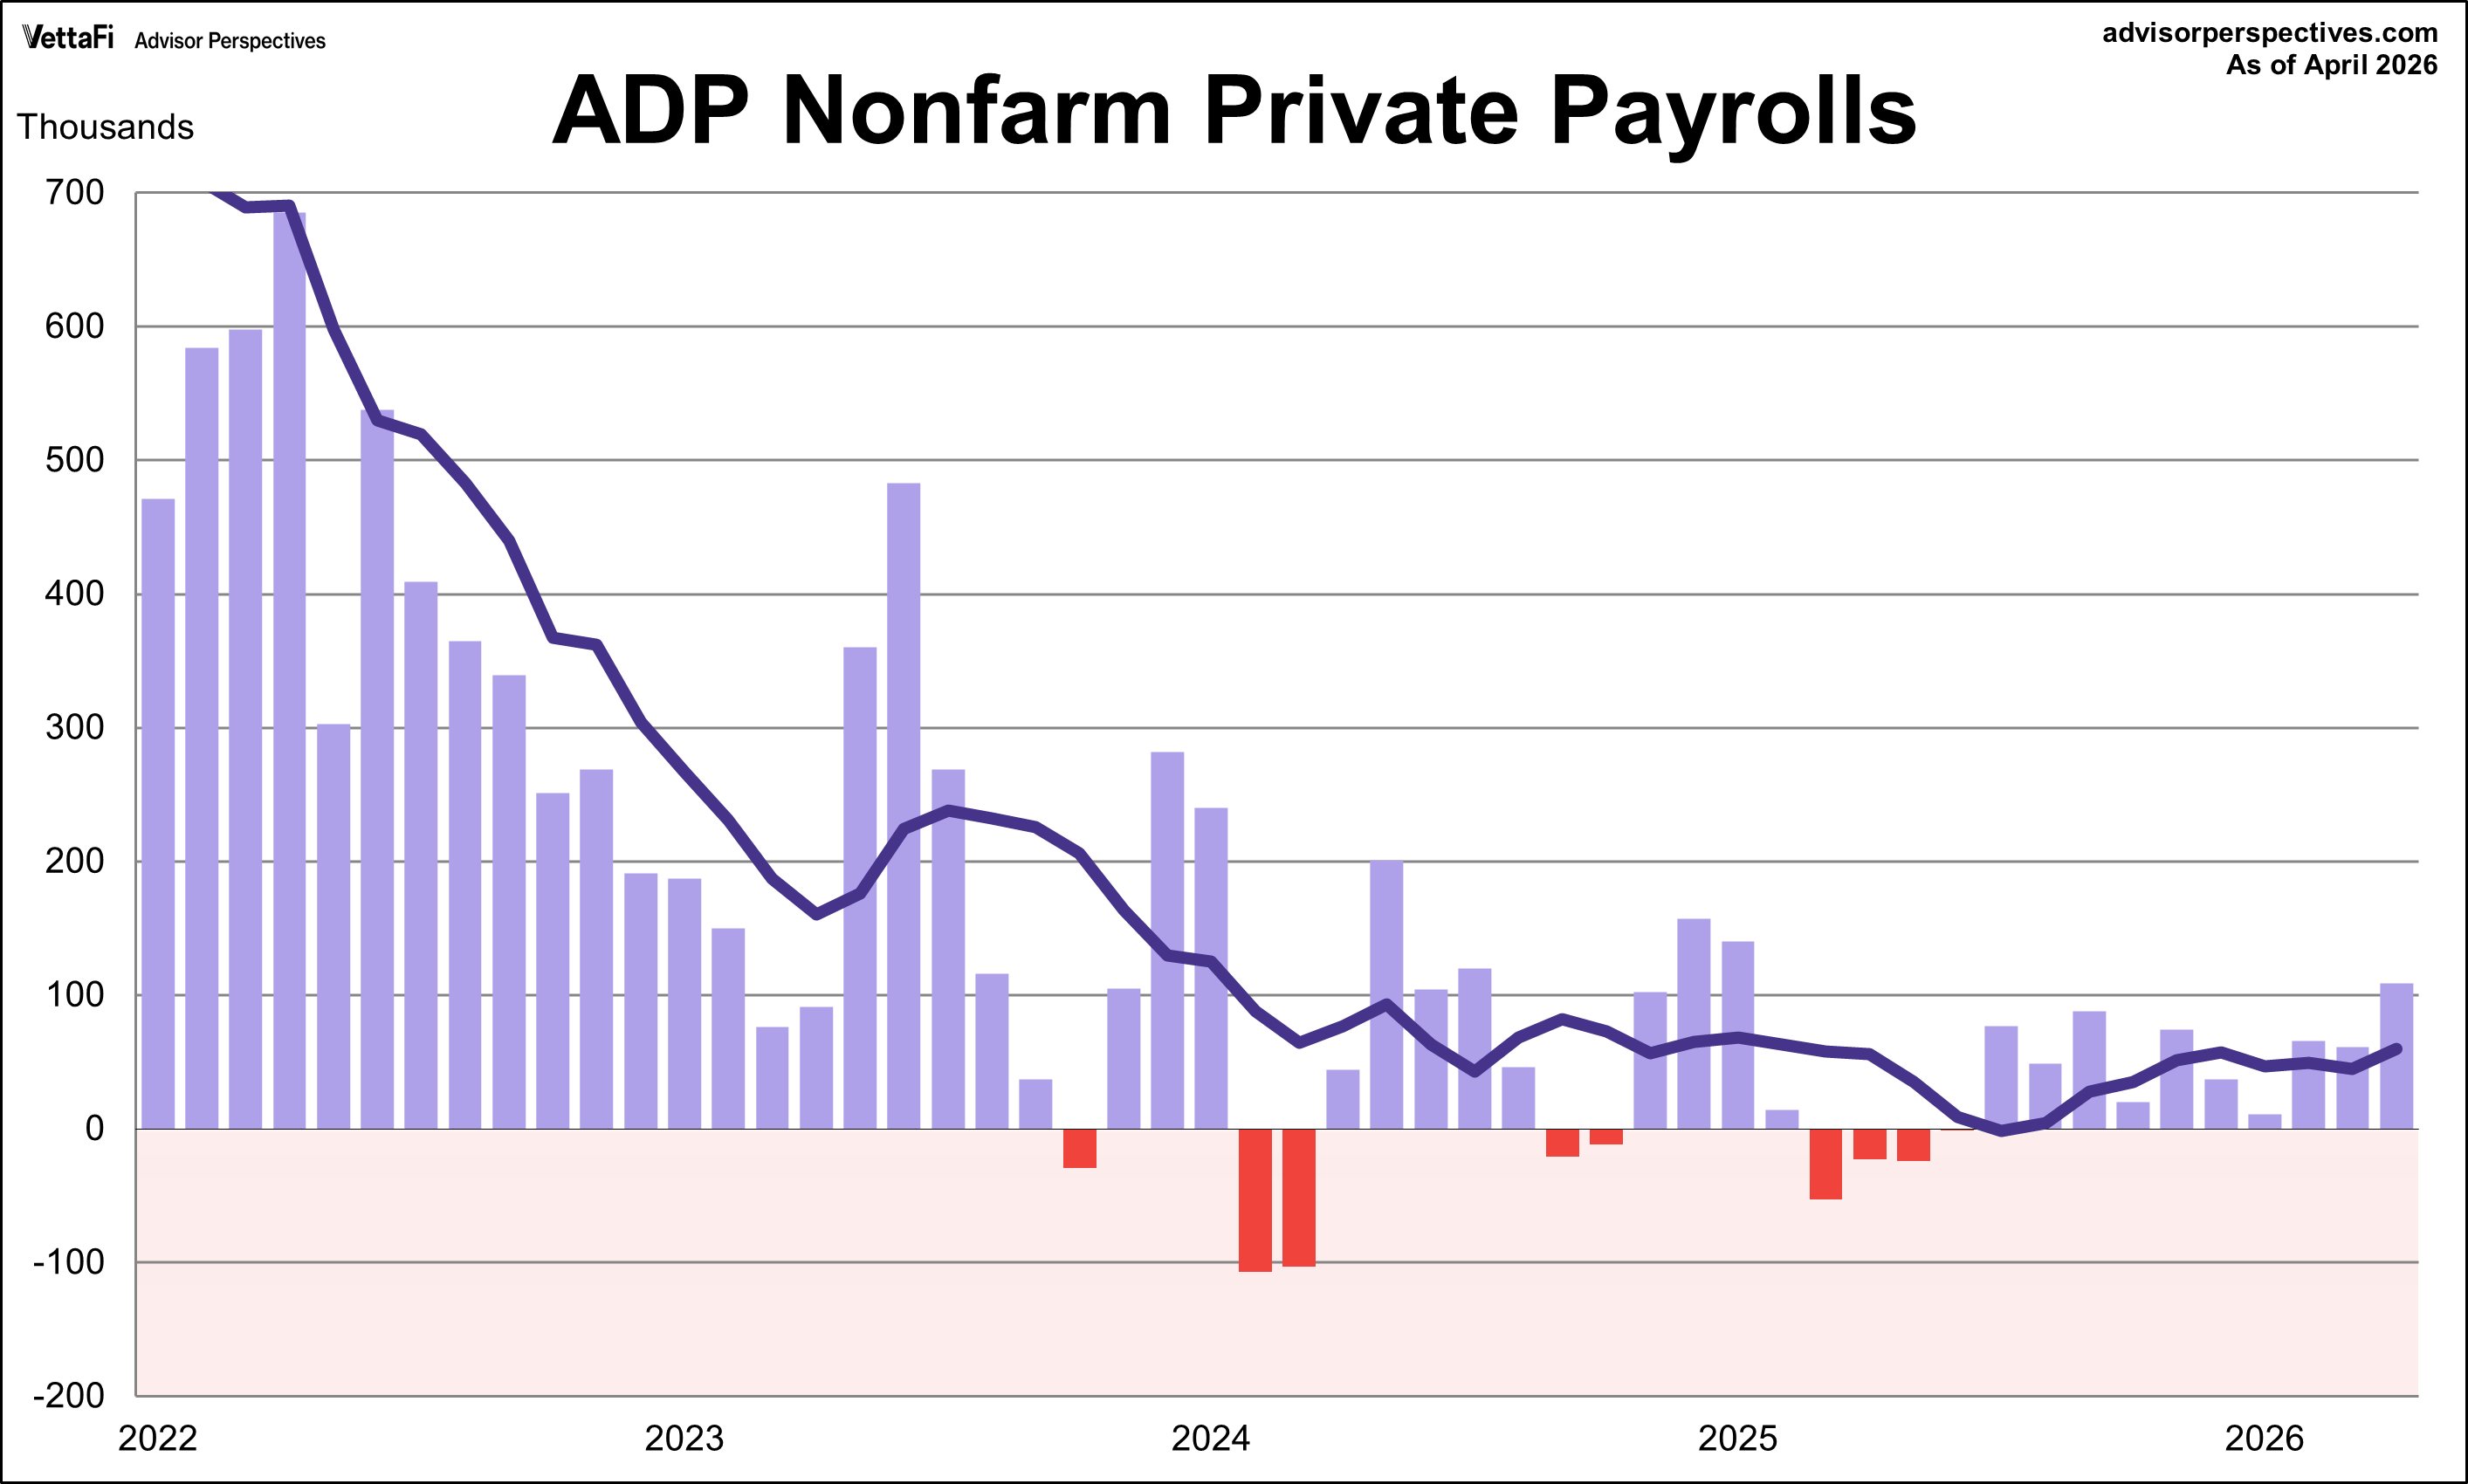
The U.S. labor market demonstrated remarkable endurance in April, with job gains outpacing expectations and private sector expansion reaching its strongest point in over a year. As the Federal Reserve maintains a steady interest rate policy, the focus now turns to upcoming inflation and retail data to gauge the sustainability of this momentum.
As market volatility lingers, the latest S&P Persistence Scorecard reveals a sobering reality for active managers.
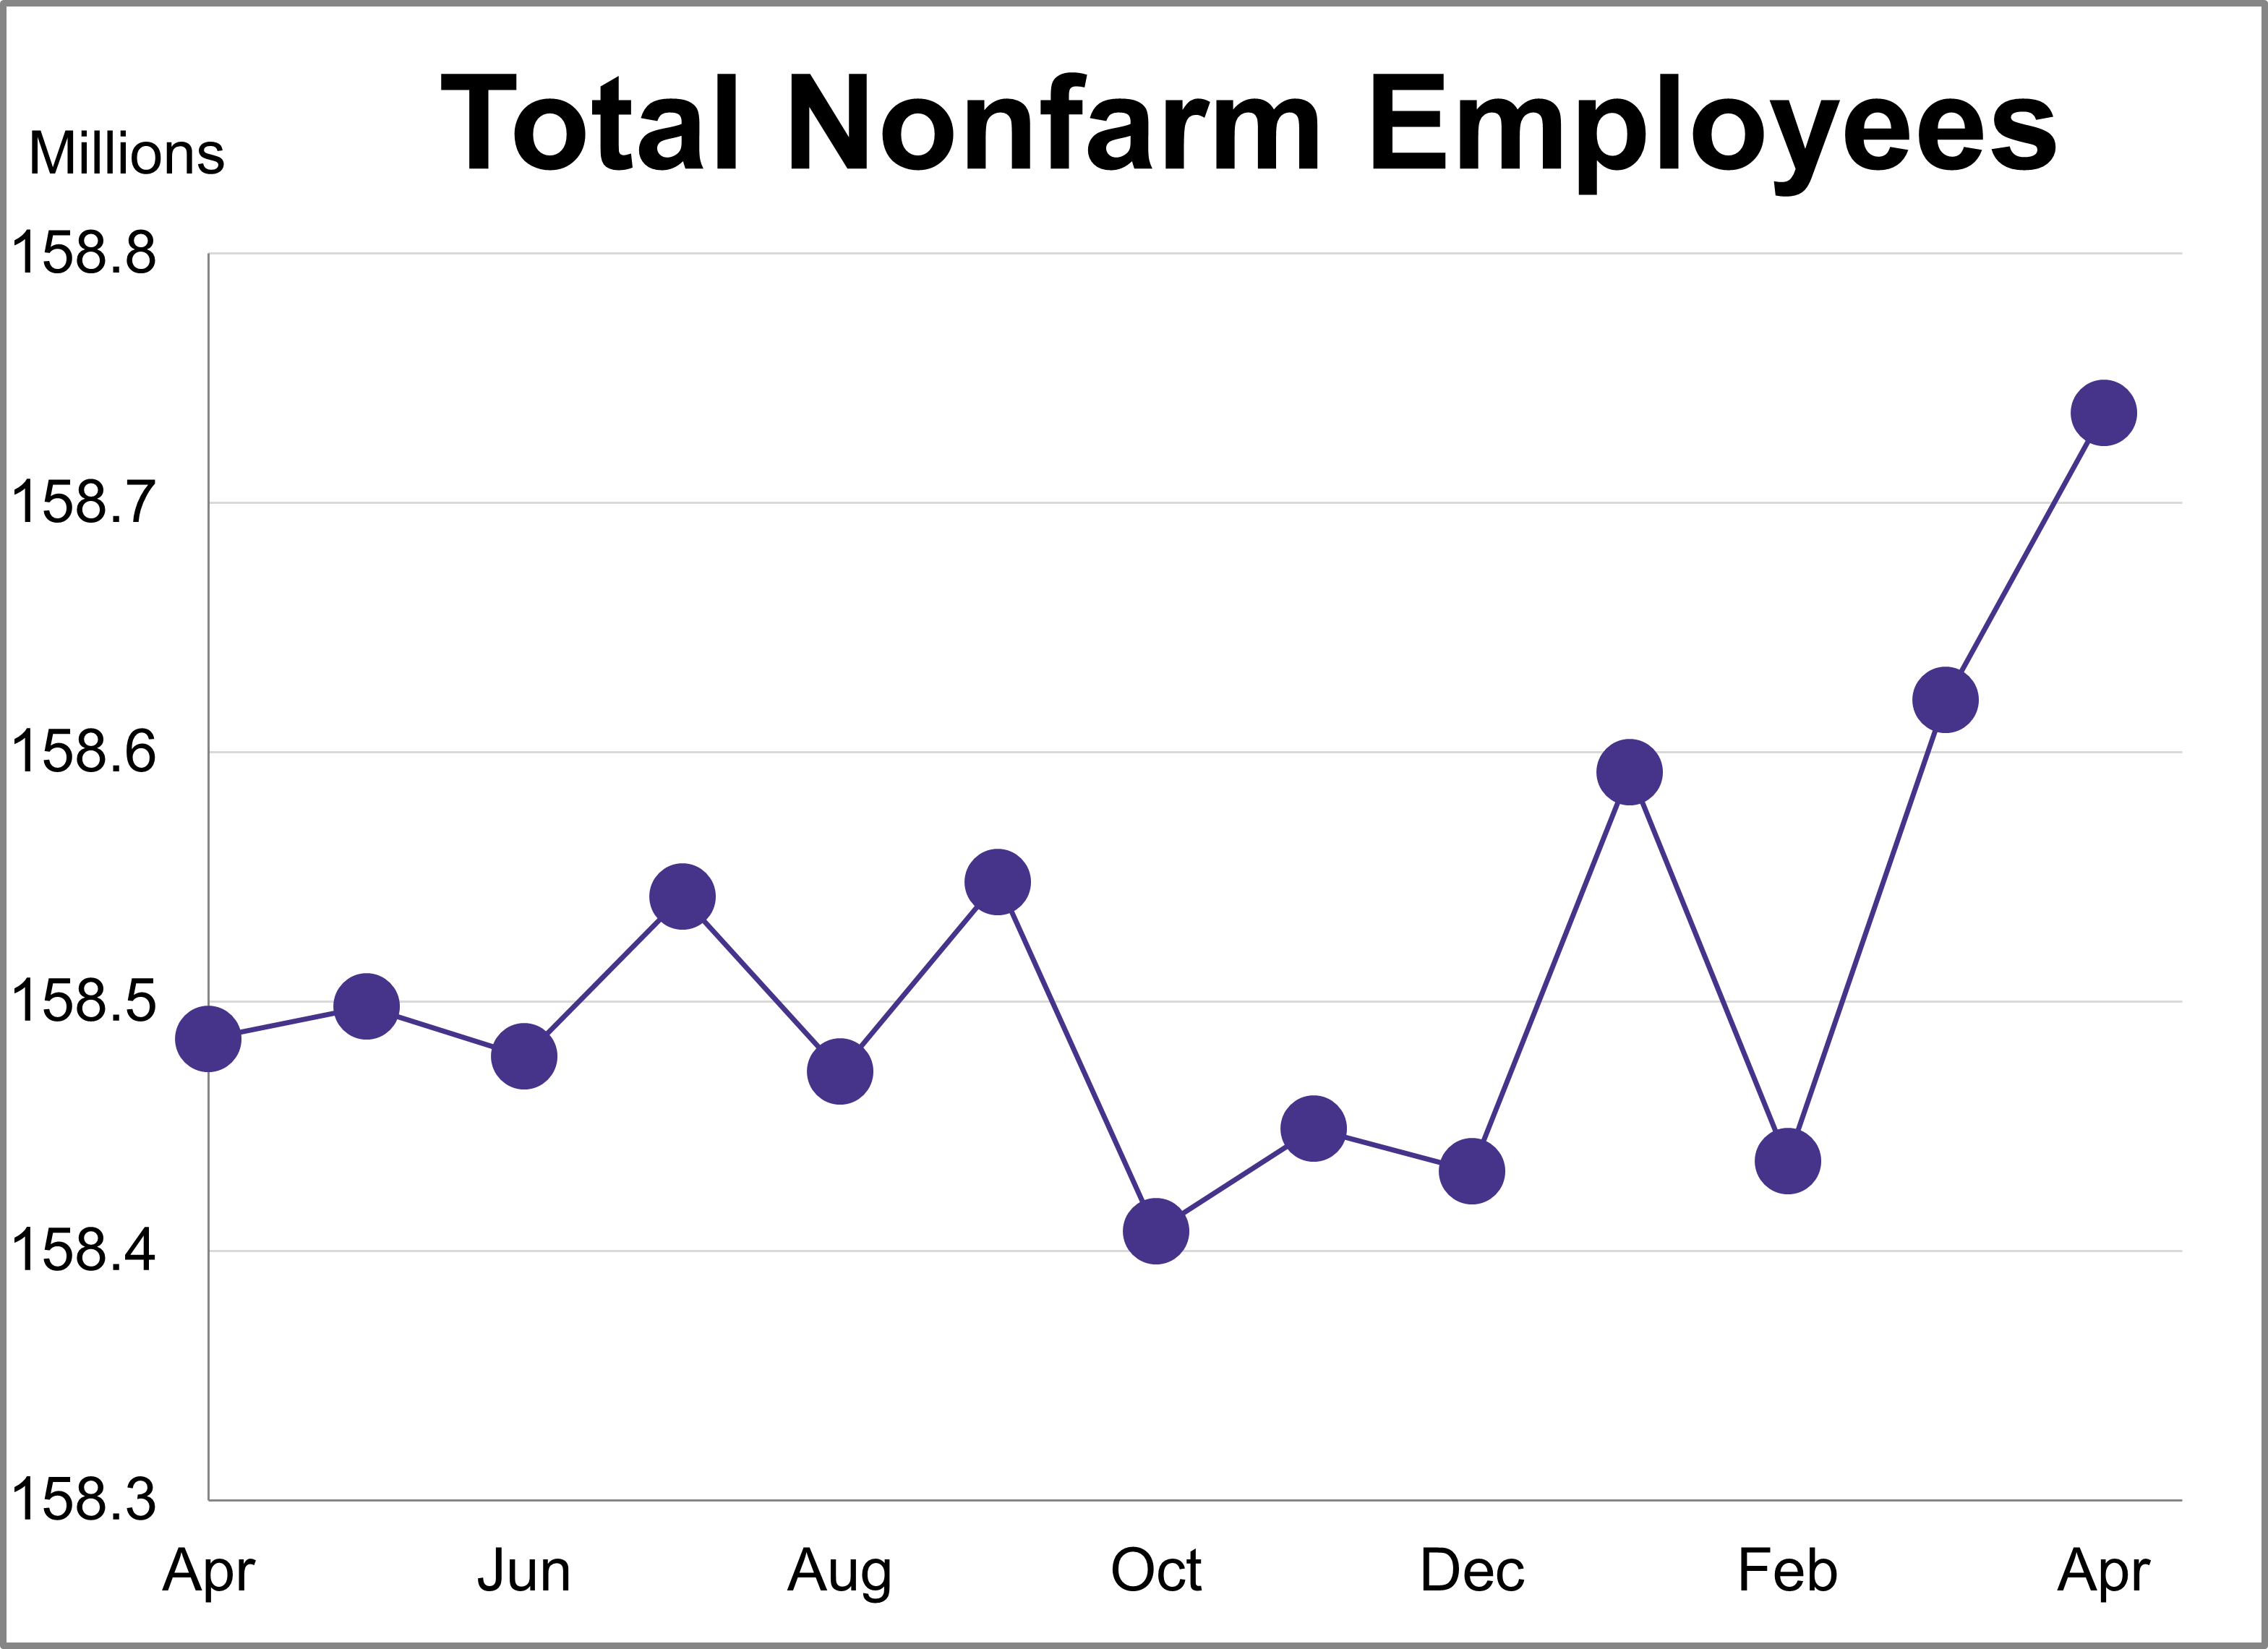
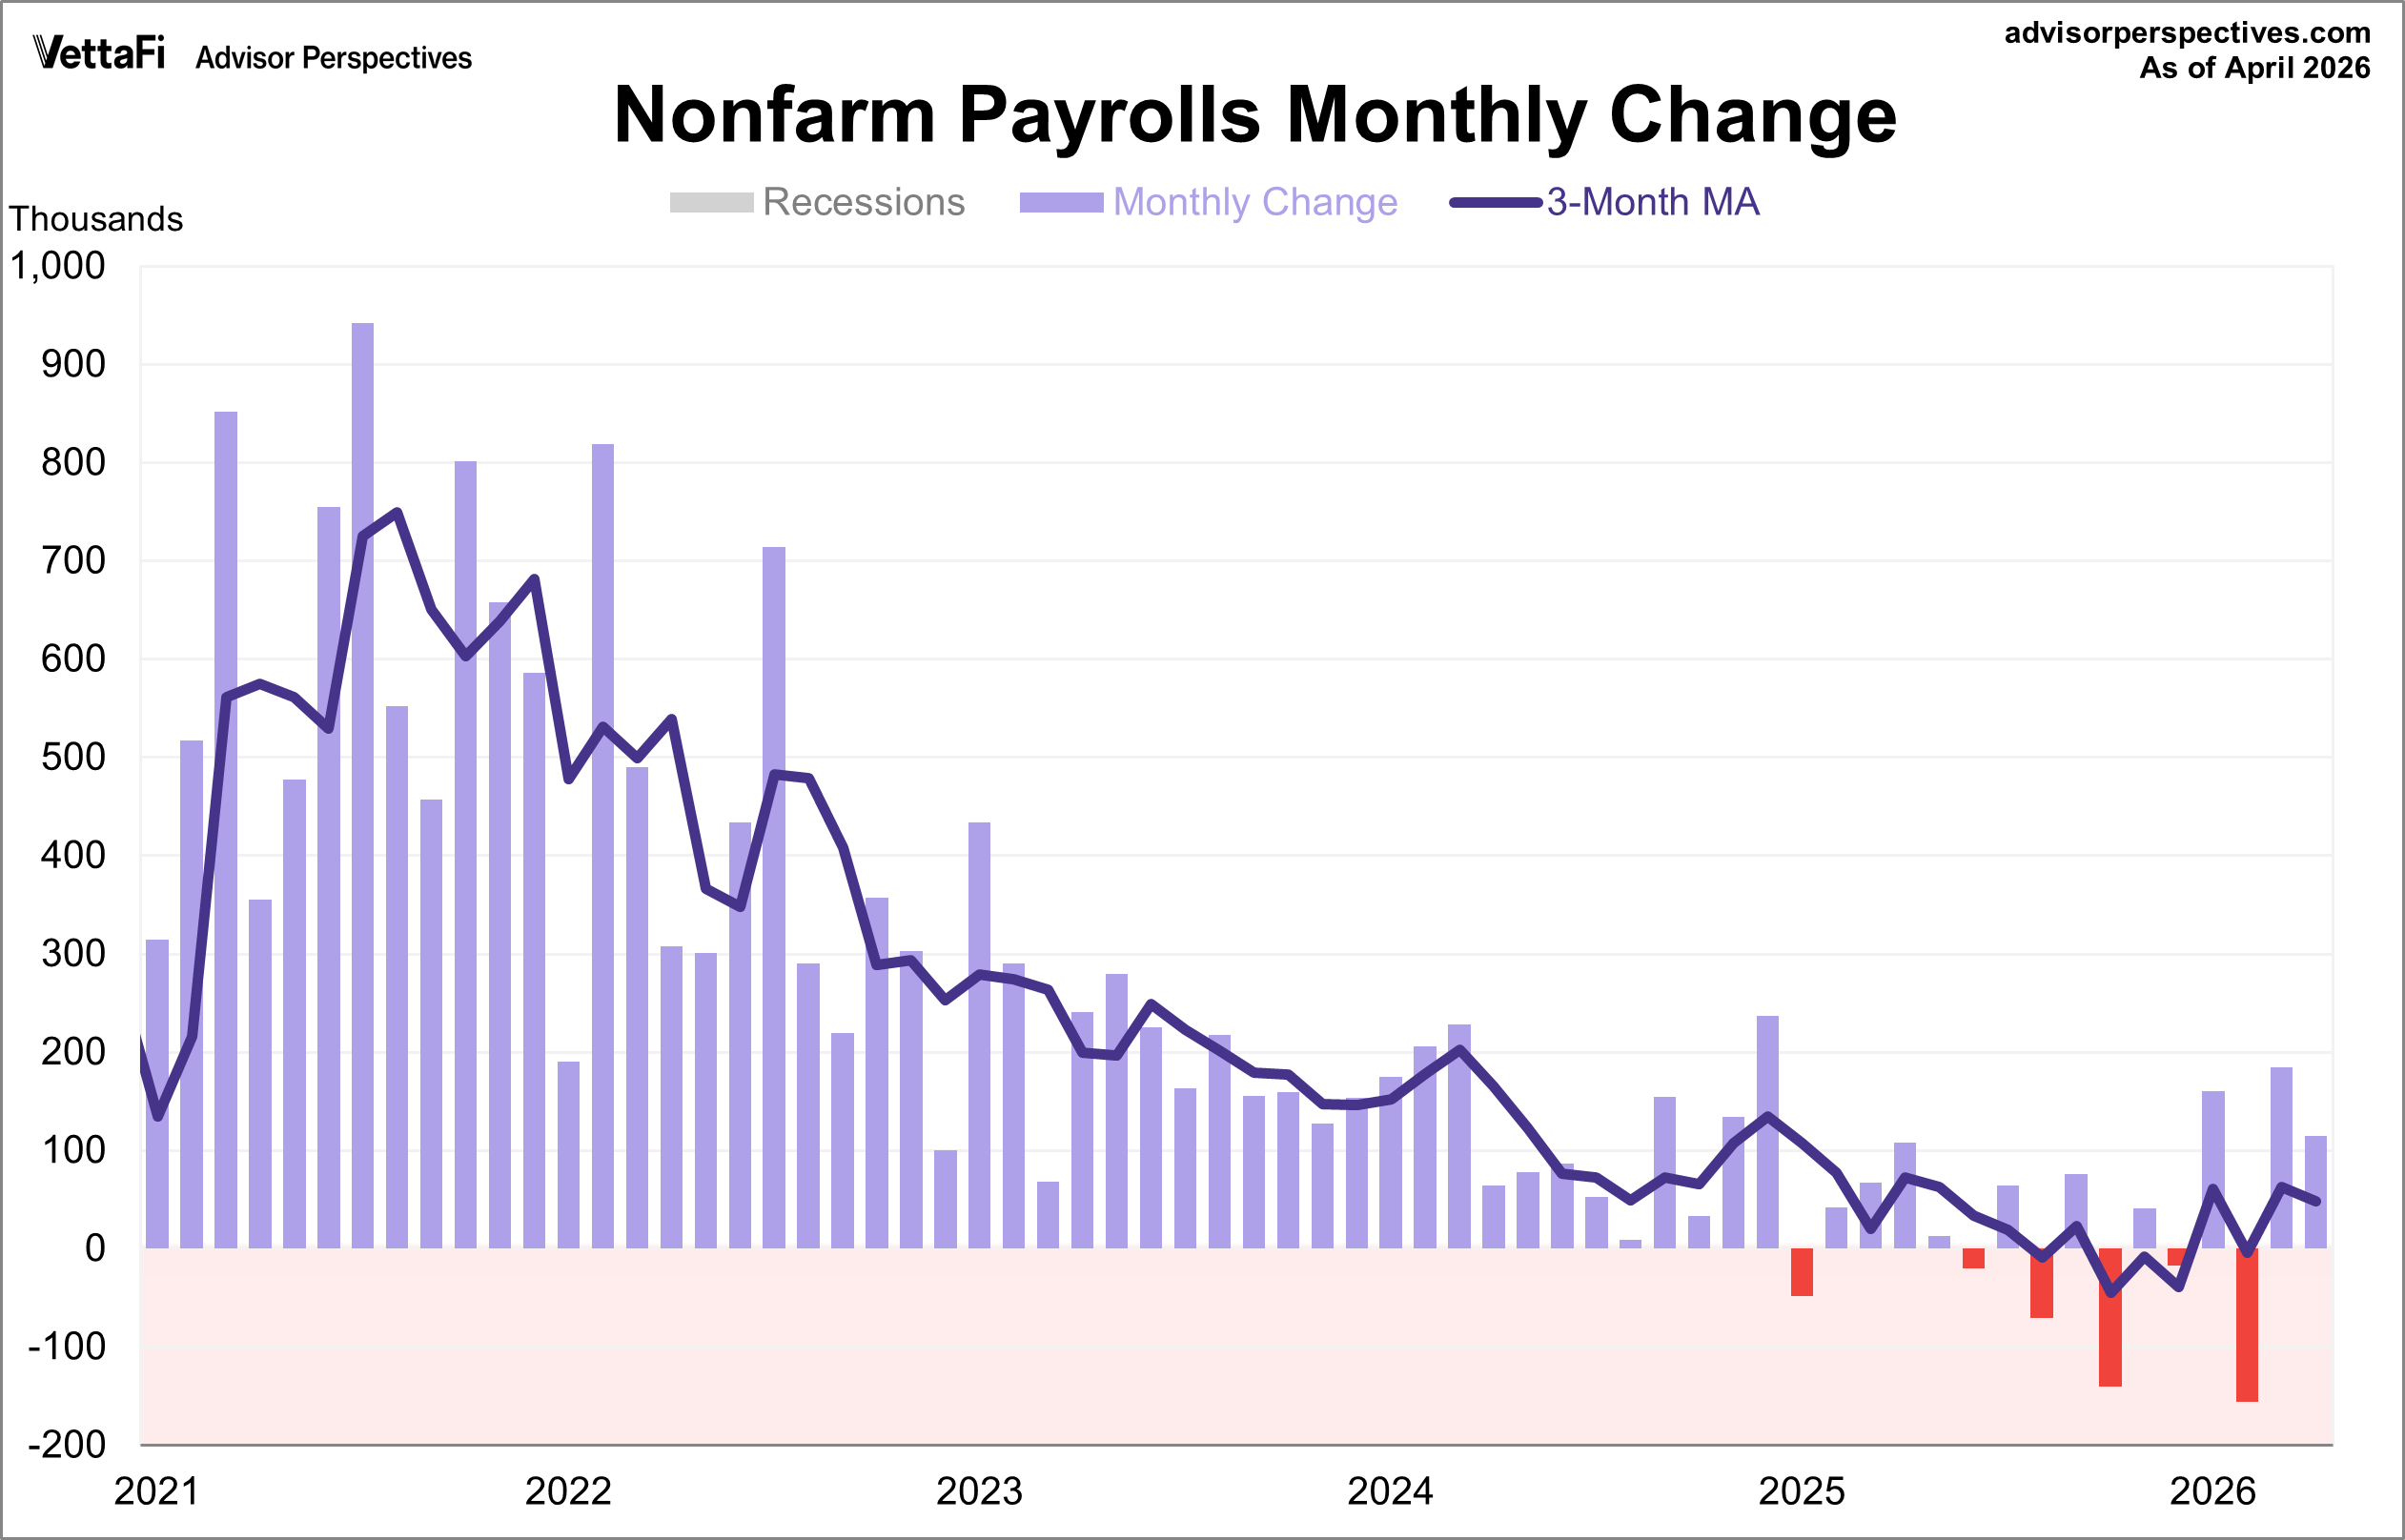
There is a general belief that there are four big indicators that the NBER Business Cycle Dating Committee weighs heavily in their cycle identification process. This commentary focuses on one of these indicators: nonfarm employment. In April, total nonfarm payrolls increased by 115,000 while the unemployment rate remained at 4.3%.
The latest employment report showed that 115,000 jobs were added in April, down from March's 185,000 gain. This figure was better than the projected addition of 65,000 jobs. Meanwhile, the unemployment rate remained at 4.3%, as expected.
Research Affiliates explains how a fundamental growth strategy can outperform traditional market-cap-weighted growth indices.
TCW's concentrated strategy targets power grid constraints over clean tech, riding demand from AI and manufacturing reshoring.
Retirement is a challenge for countless investors and their advisors. A new report from Goldman Sachs has more.
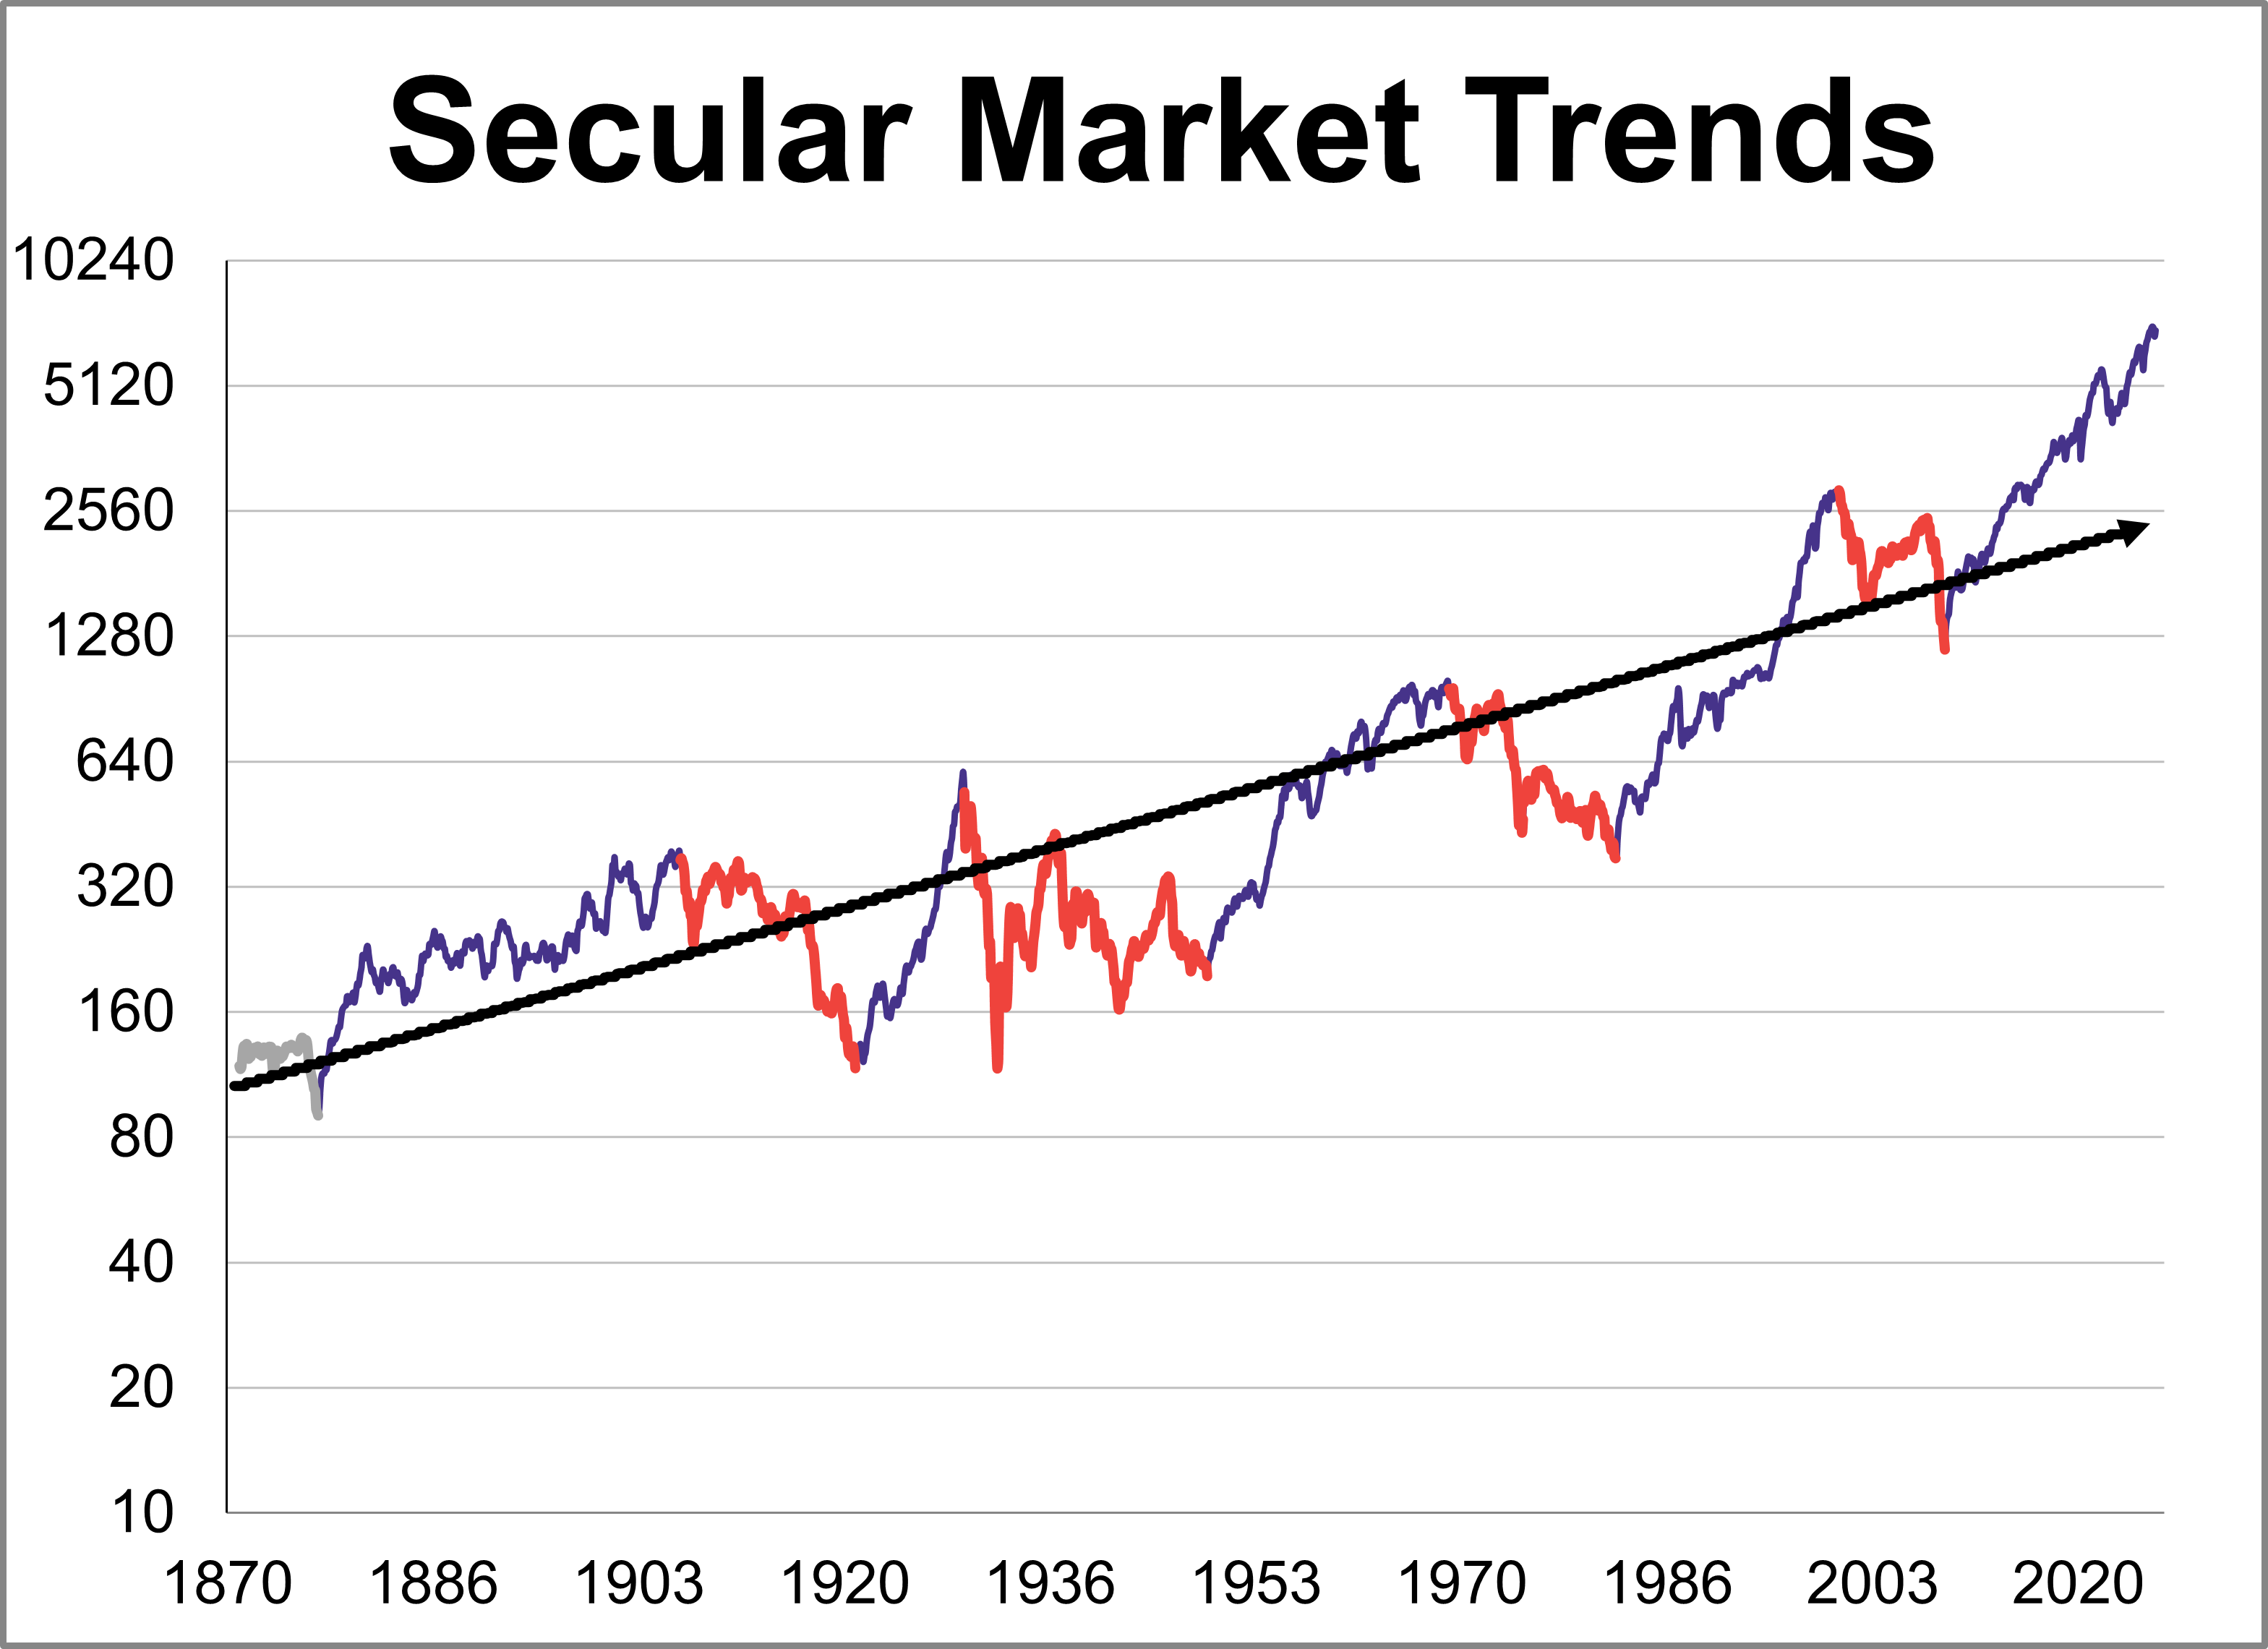
The S&P 500 real monthly averages of daily closes reached a its all-time high in January 2026. Let's examine the past to broaden our understanding of the range of historical bull and bear market trends in market performance.
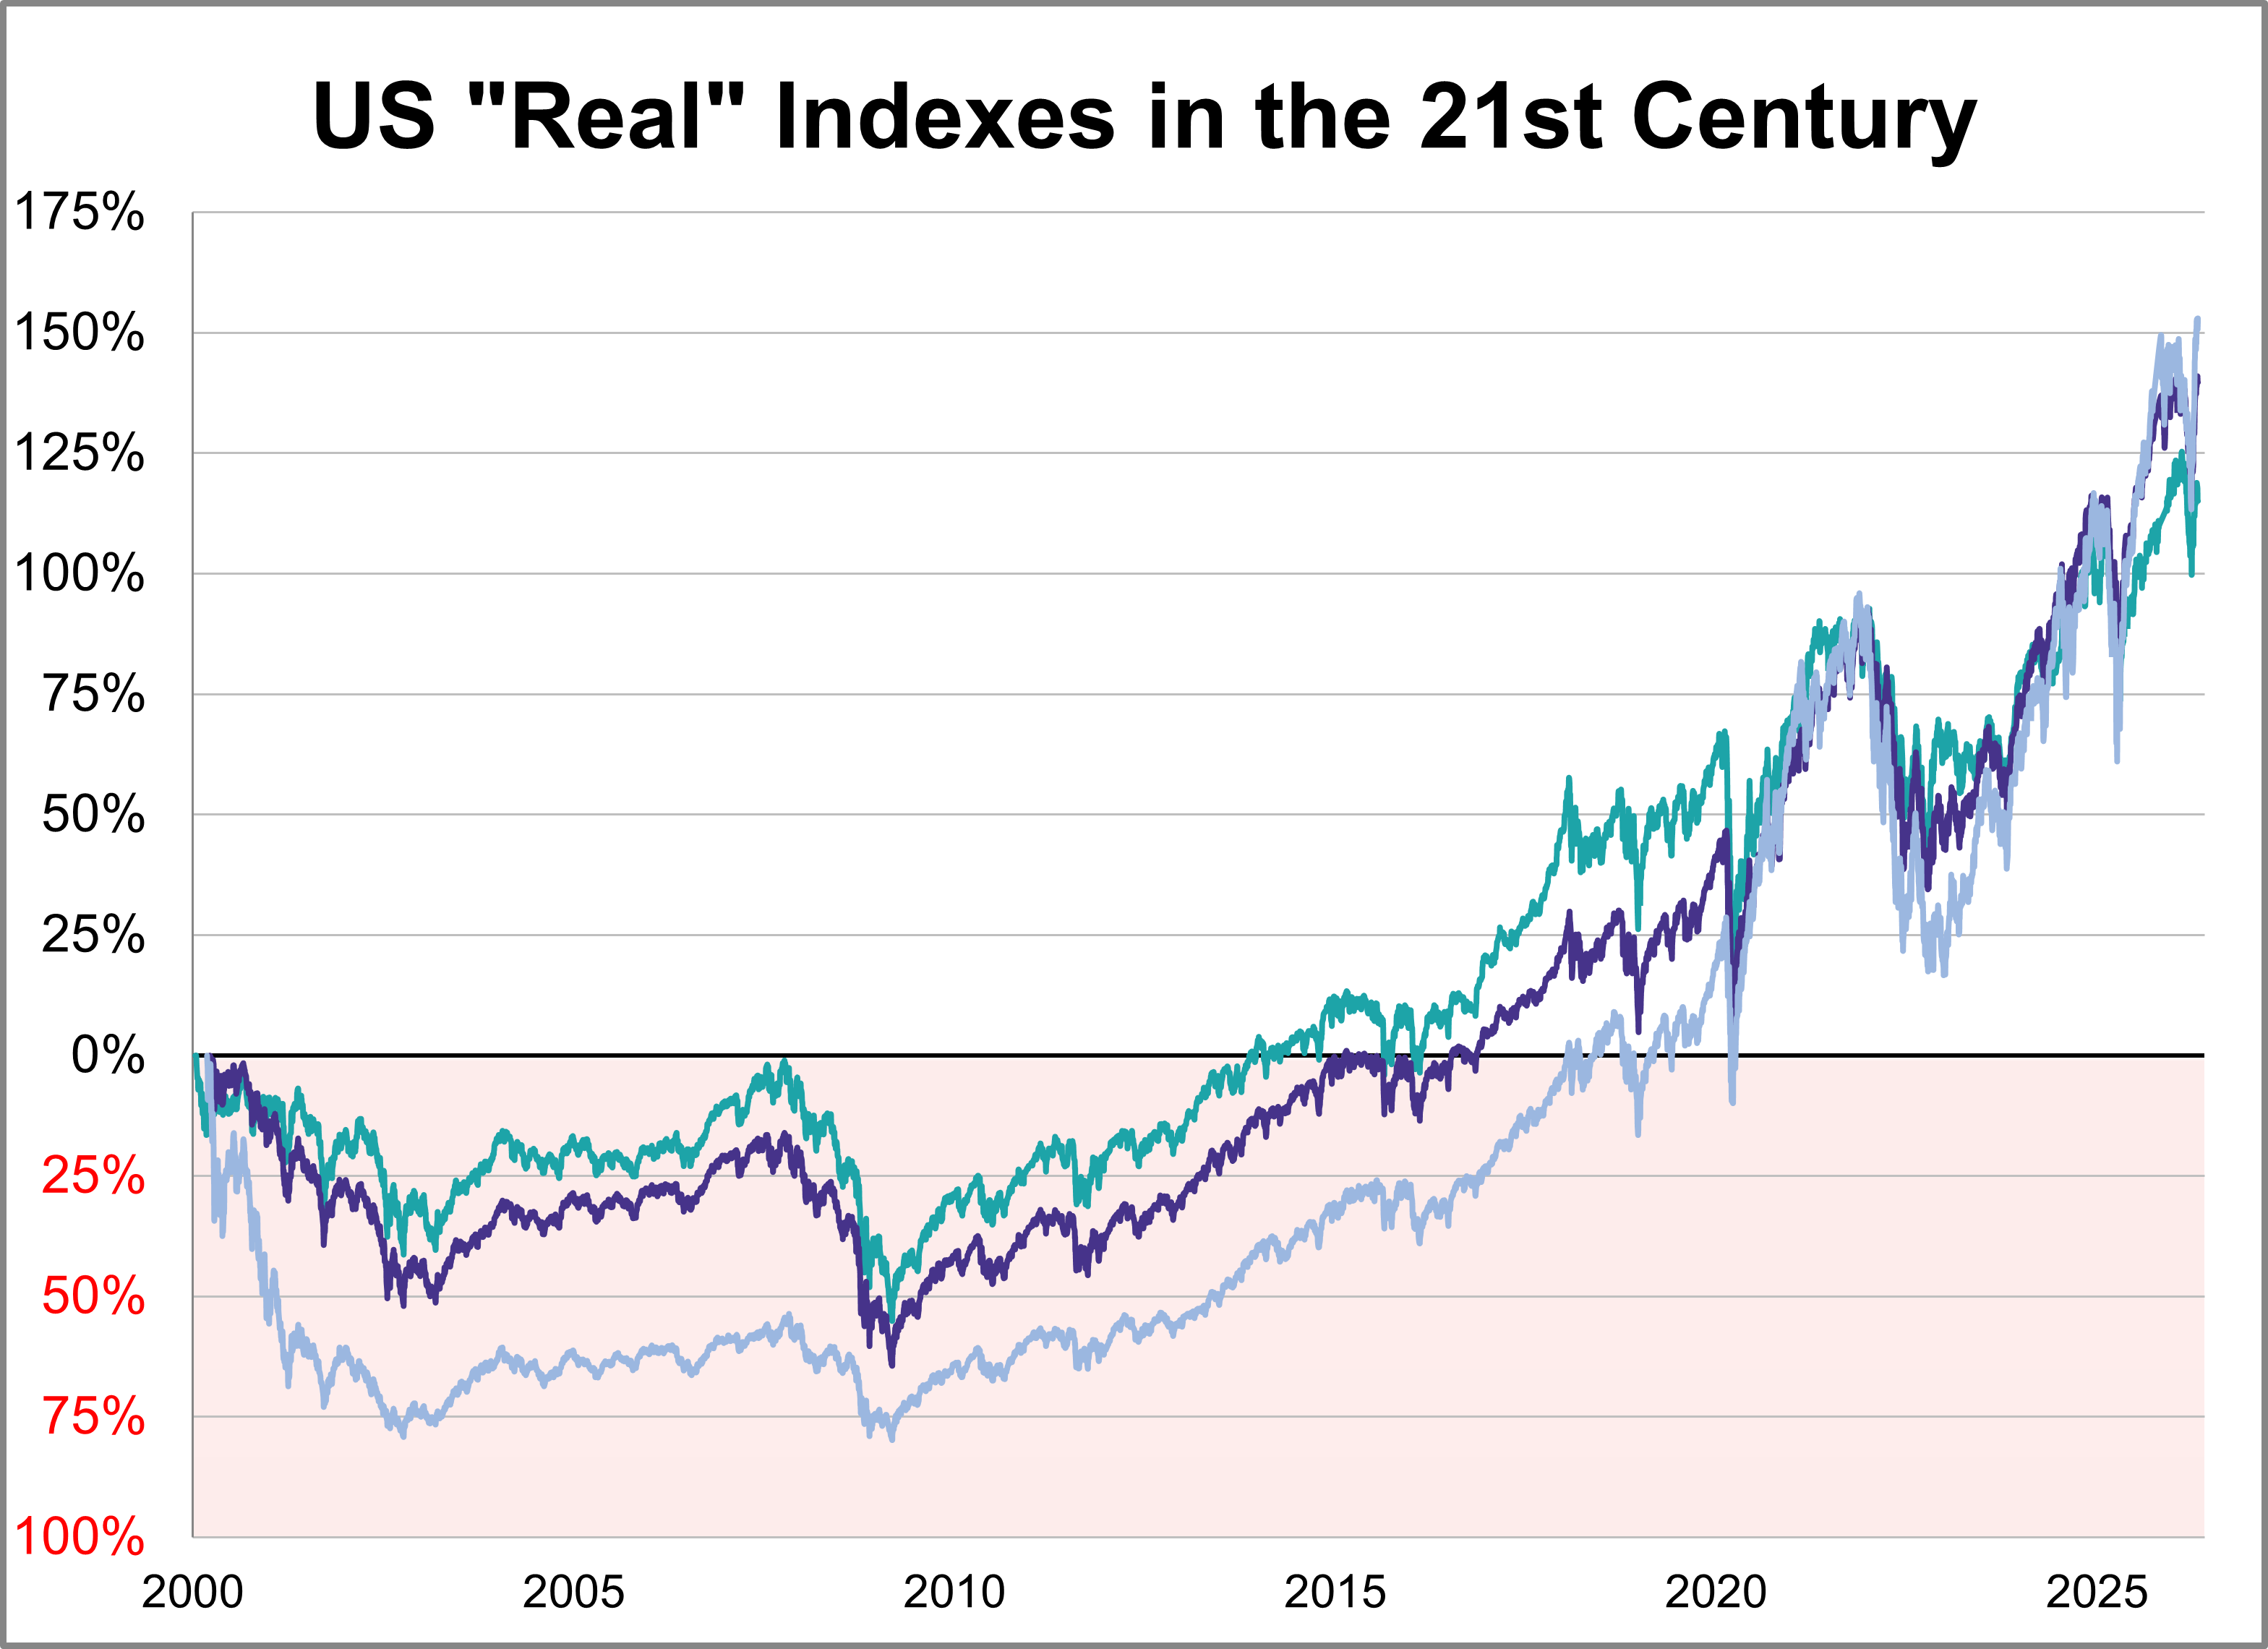
Here is a look at real (inflation-adjusted) charts of the S&P 500, Dow 30, and Nasdaq composite since their 2000 highs. We've updated this through the April 2026 close.
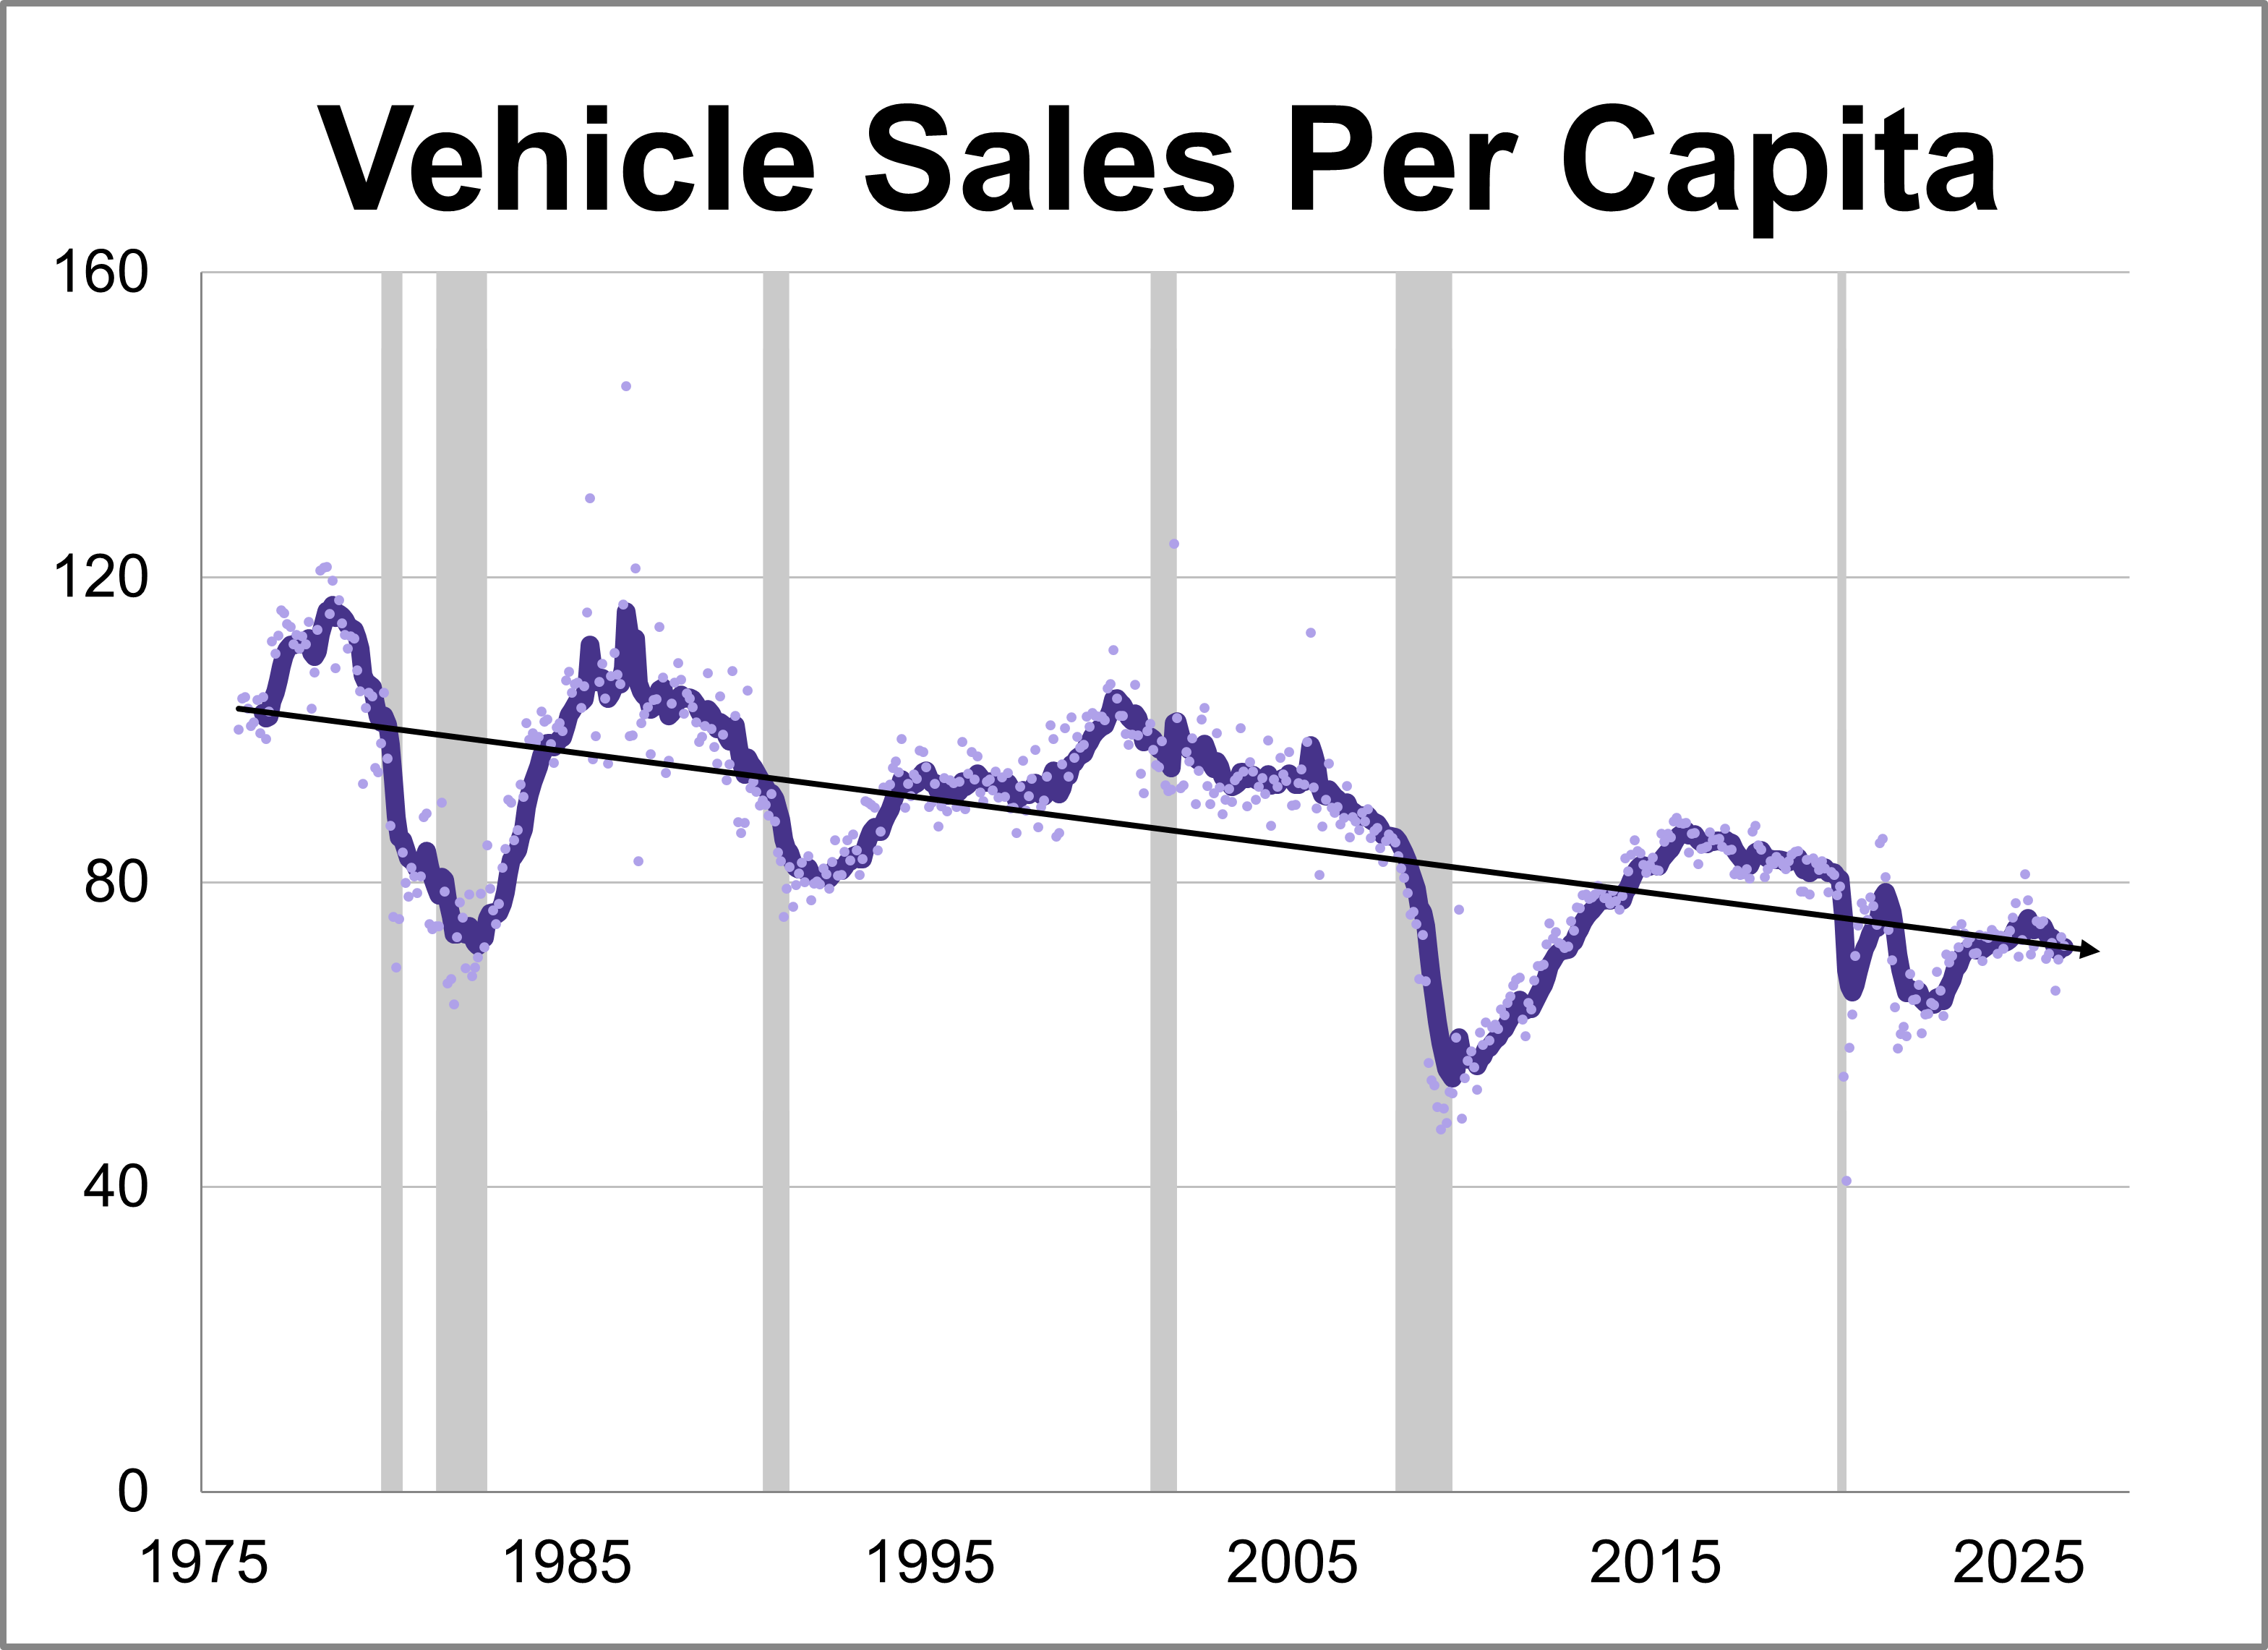
Vehicle sales fell for the first time in three months in April, coming in at a seasonally adjusted annual rate of 15.920 million units. This represents a 1.5% decline from the previous month and a 7.1% drop from one year ago.
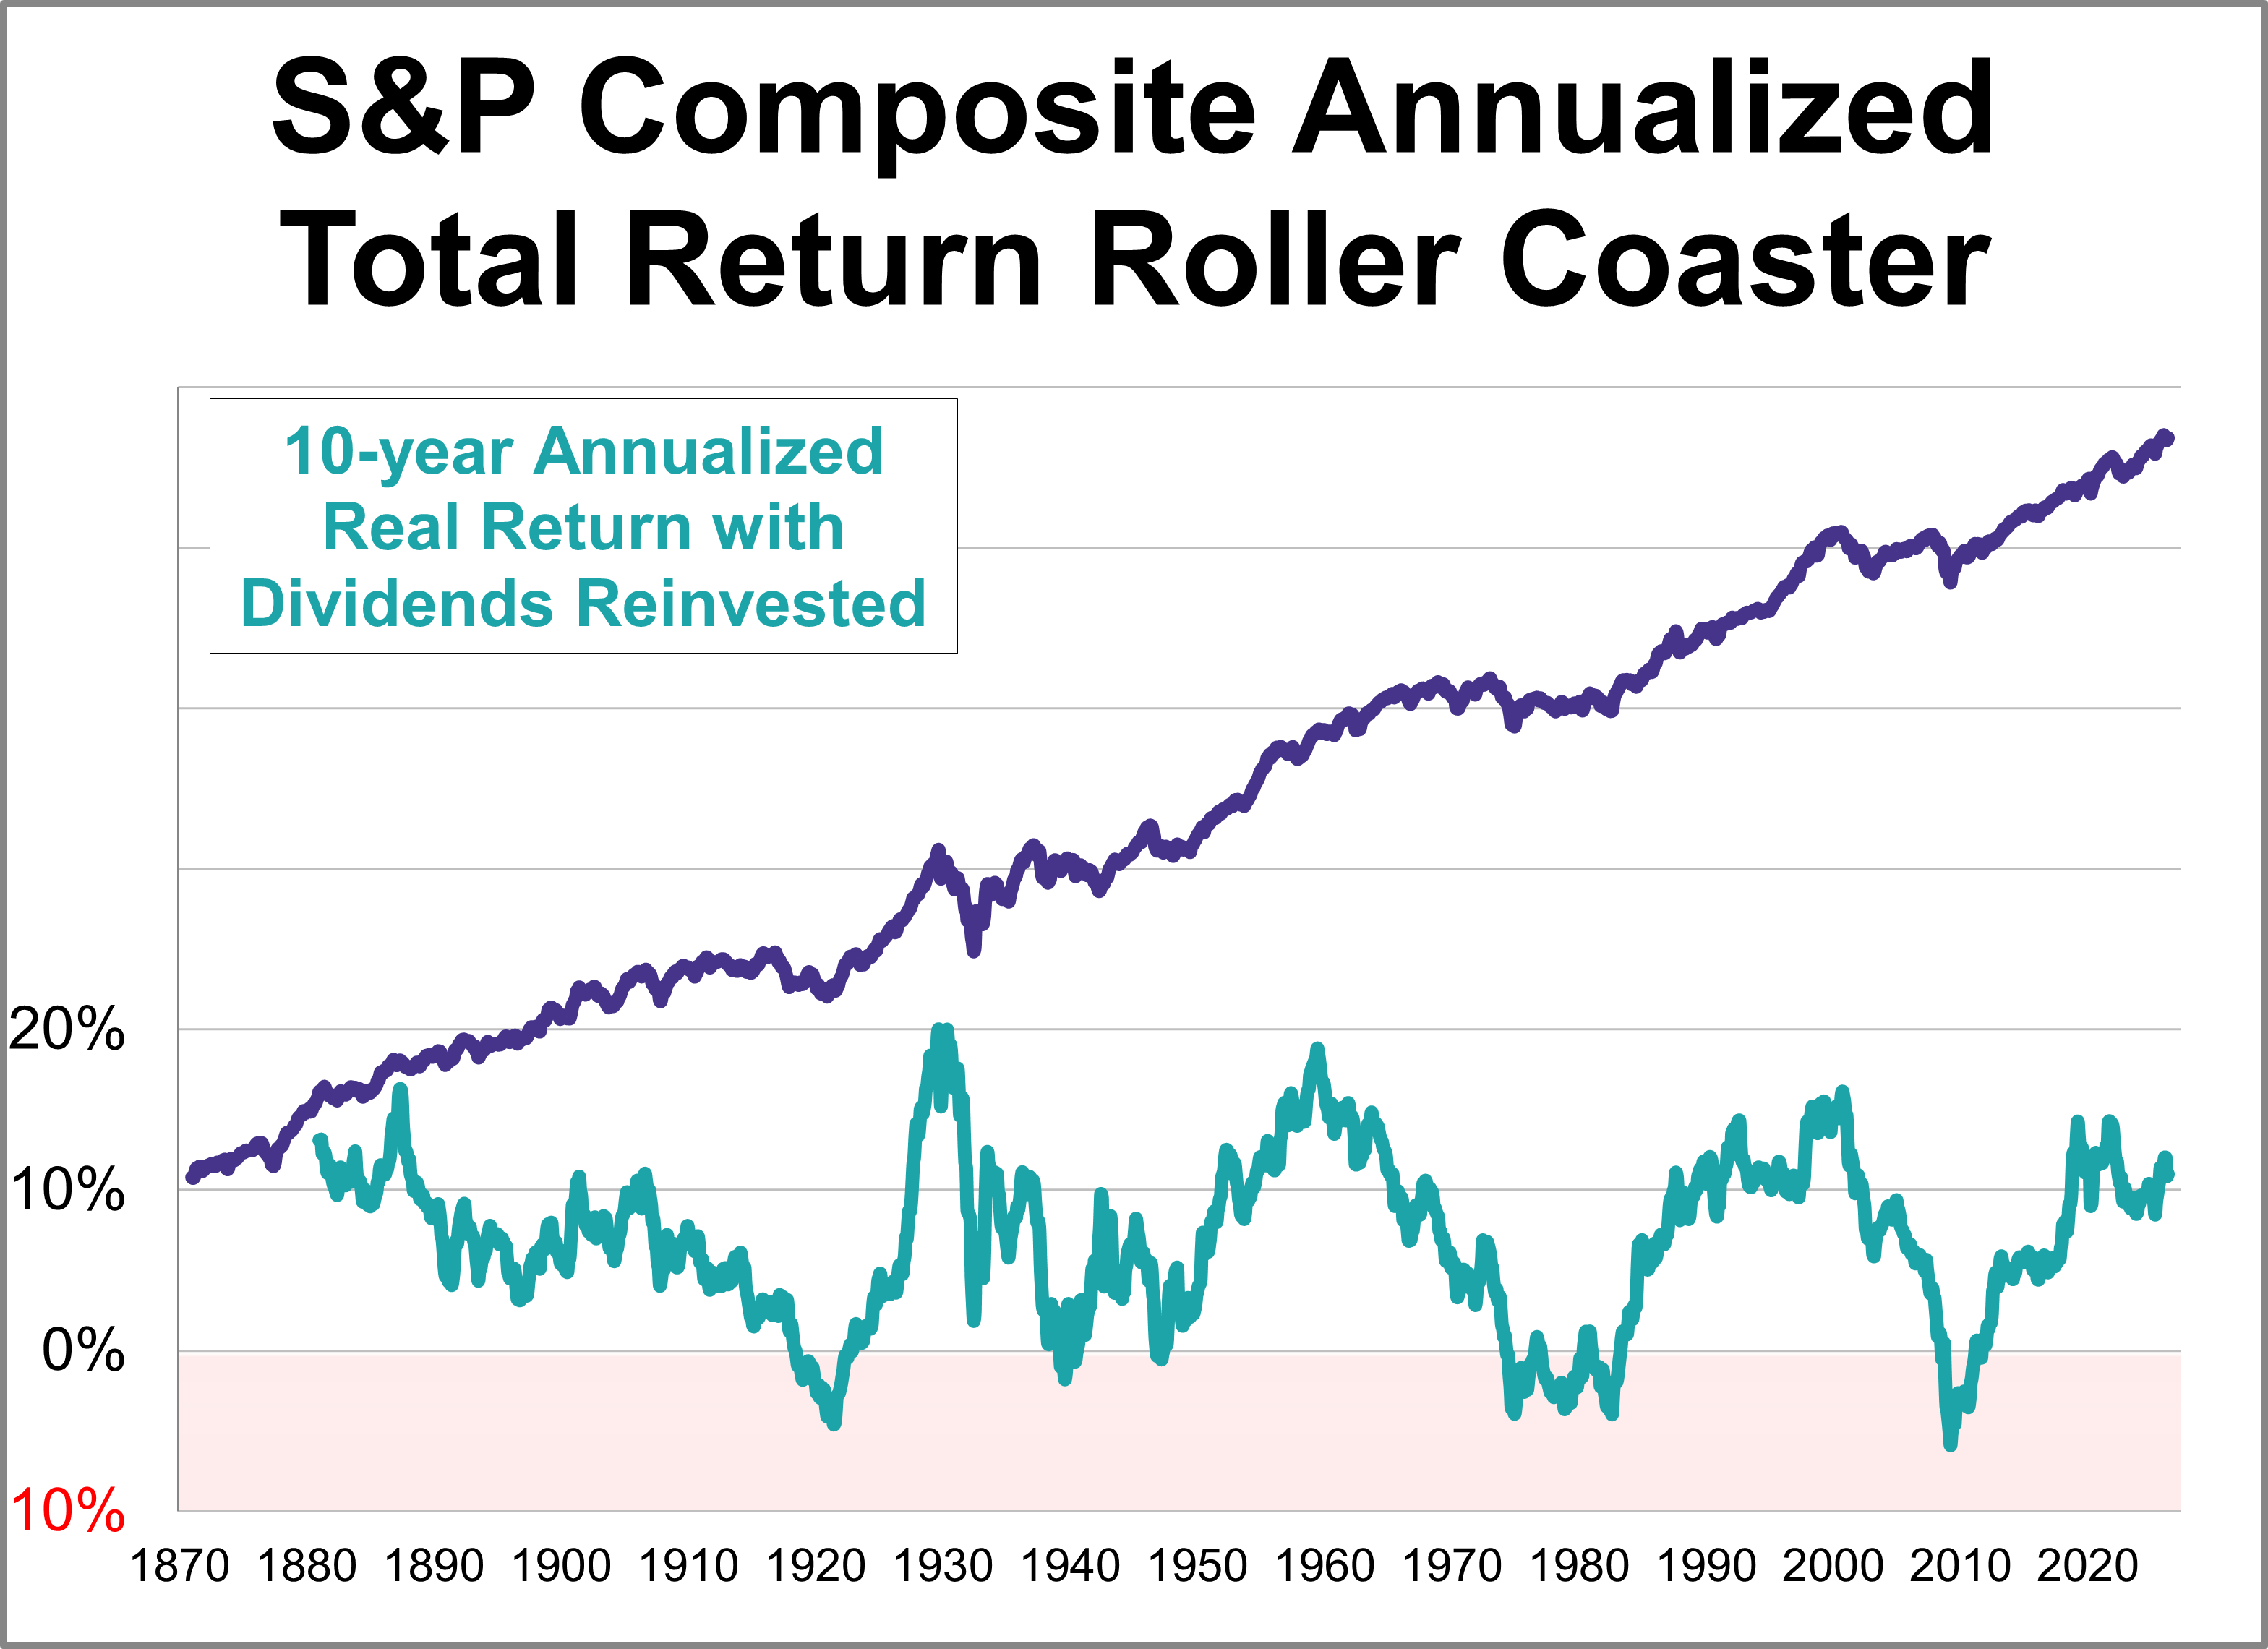
Here's an interesting set of charts that will especially resonate with those of us who follow economic and market cycles. Imagine that five years ago you invested $10,000 in the S&P 500. How much would it be worth today, with dividends reinvested but adjusted for inflation?
April saw a variety of articles published on Advisor Perspectives address core questions with which advisors and their client must contend.
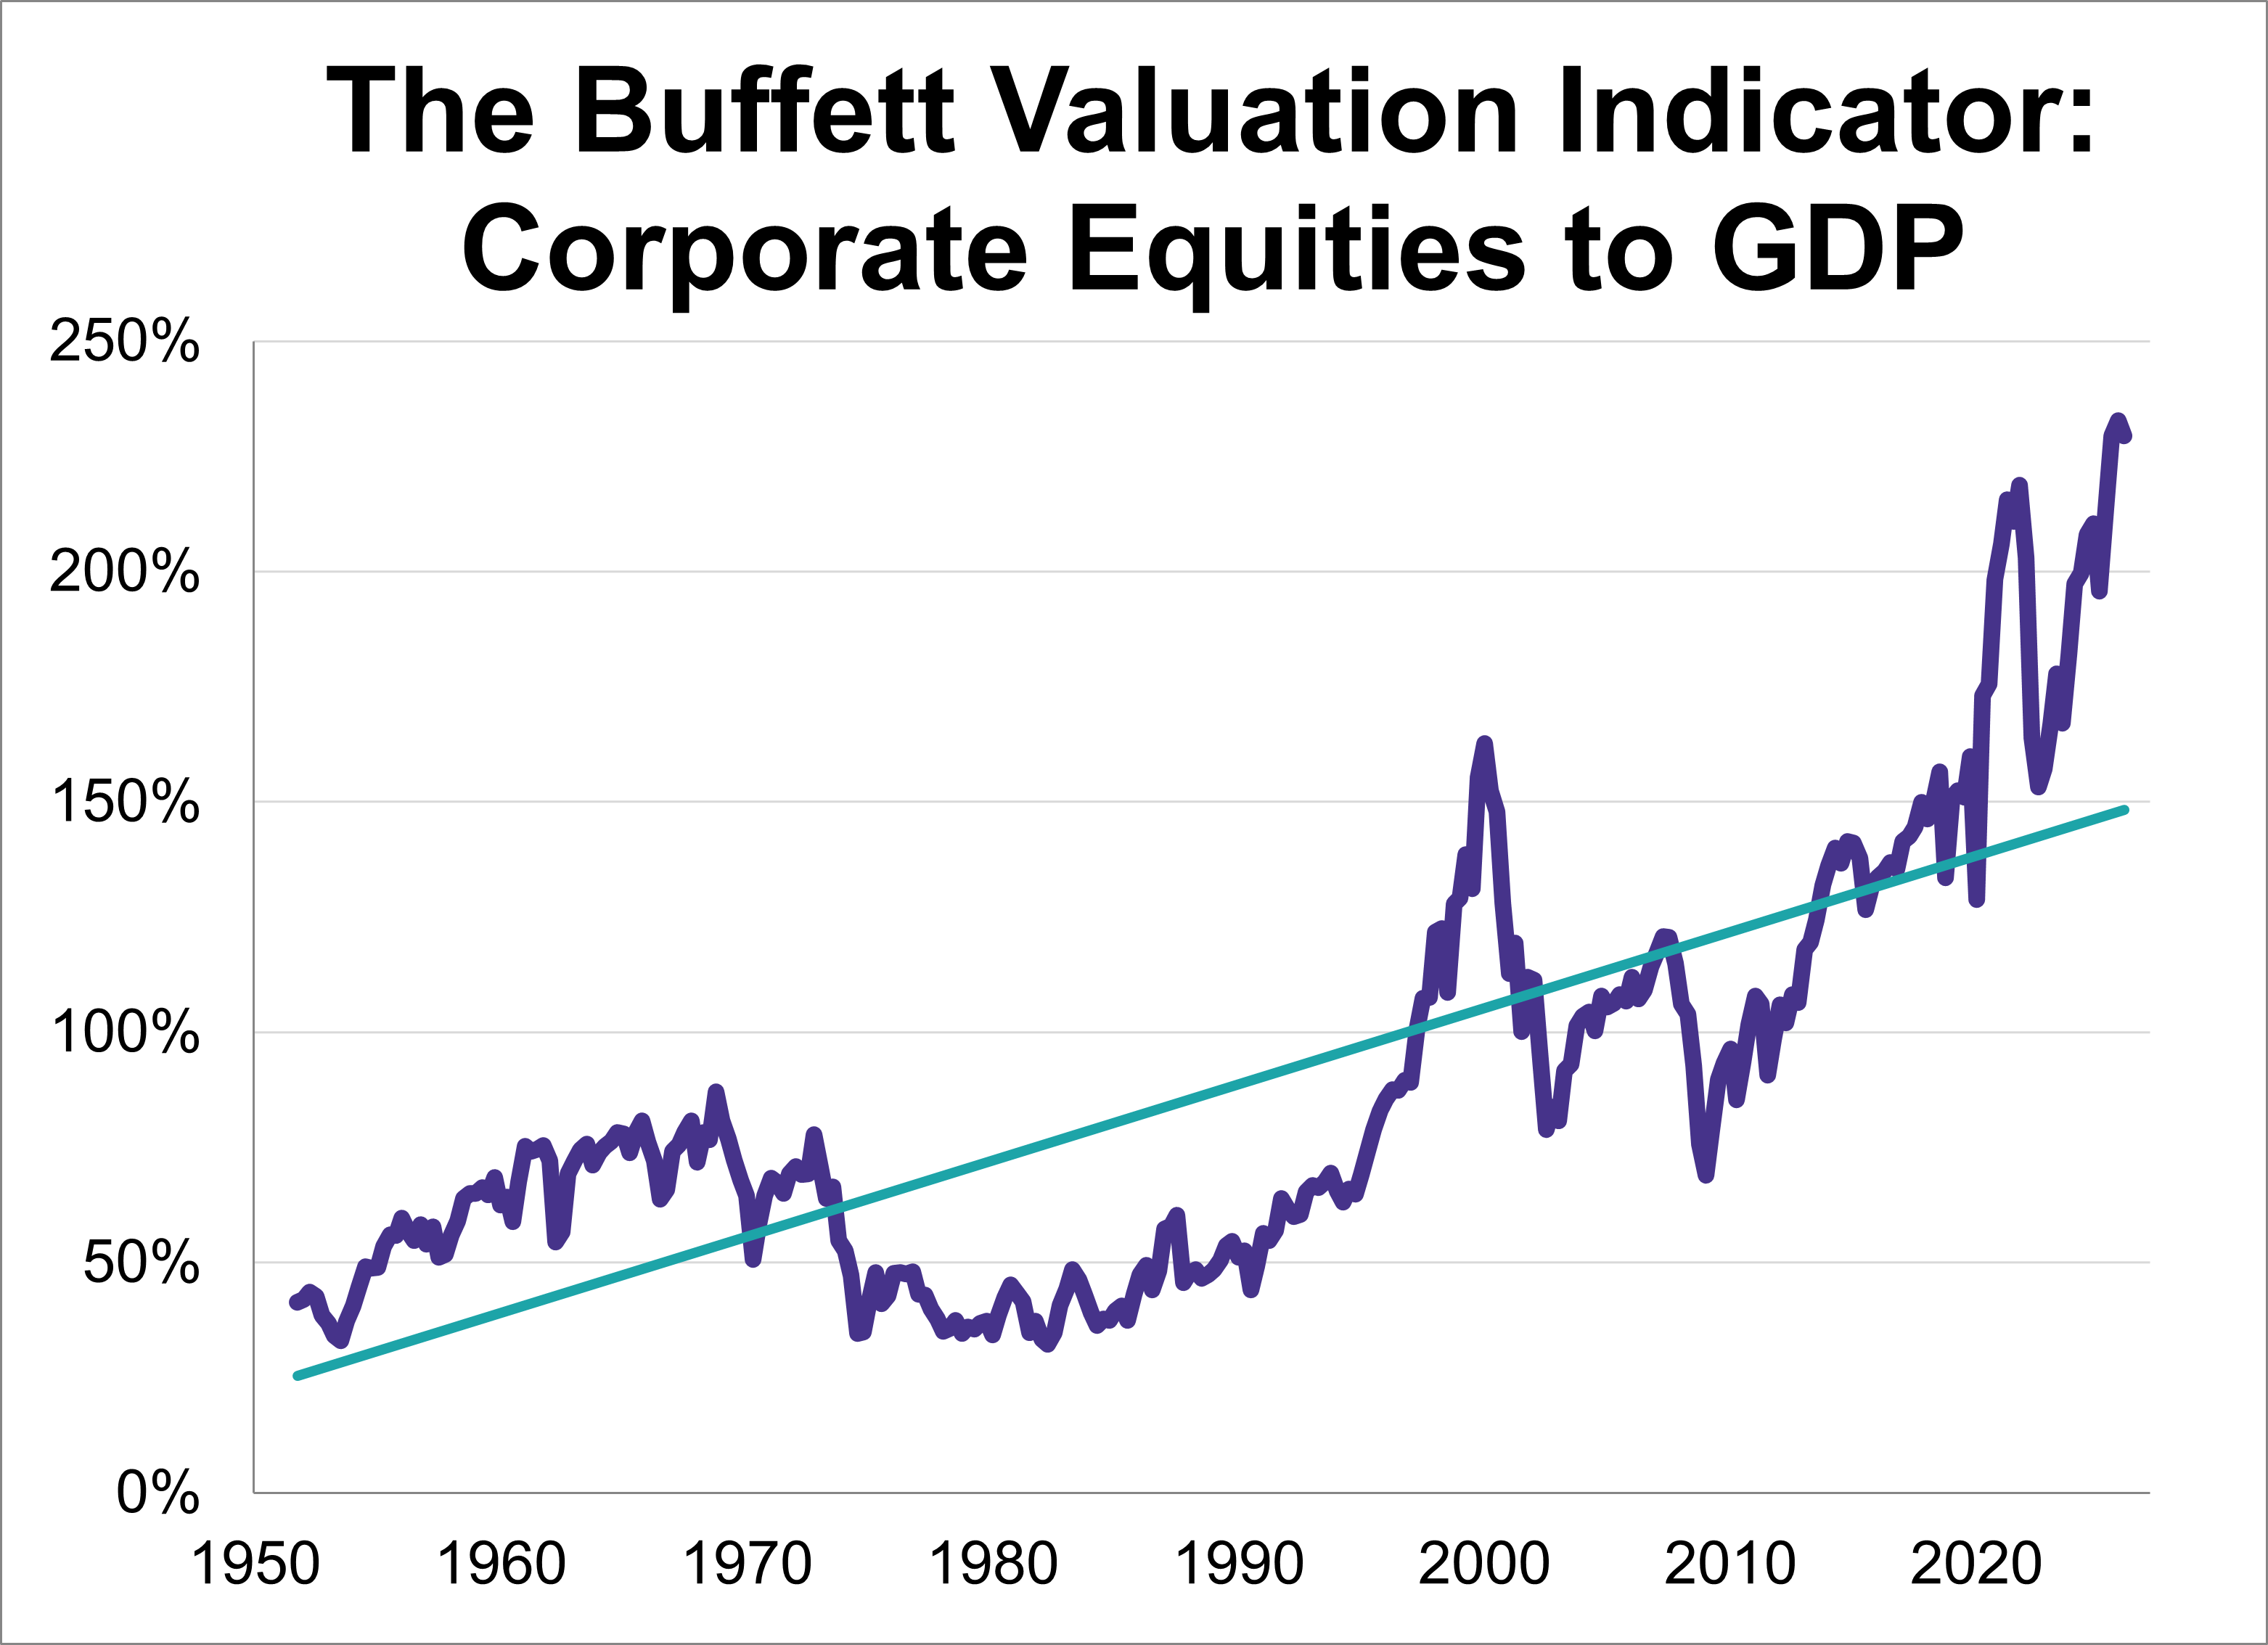
Following the Q1 GDP advance estimate, the 'Buffett Indicator'—the ratio of corporate equities to GDP—now stands at 229.5%. This marks the second-highest reading in history, eclipsed only by the previous quarter."
The ADP employment report revealed that 109,000 nonfarm private jobs were added in April, the largest monthly growth since January 2025. However, the latest figure was lower than the expected 118,000 addition.
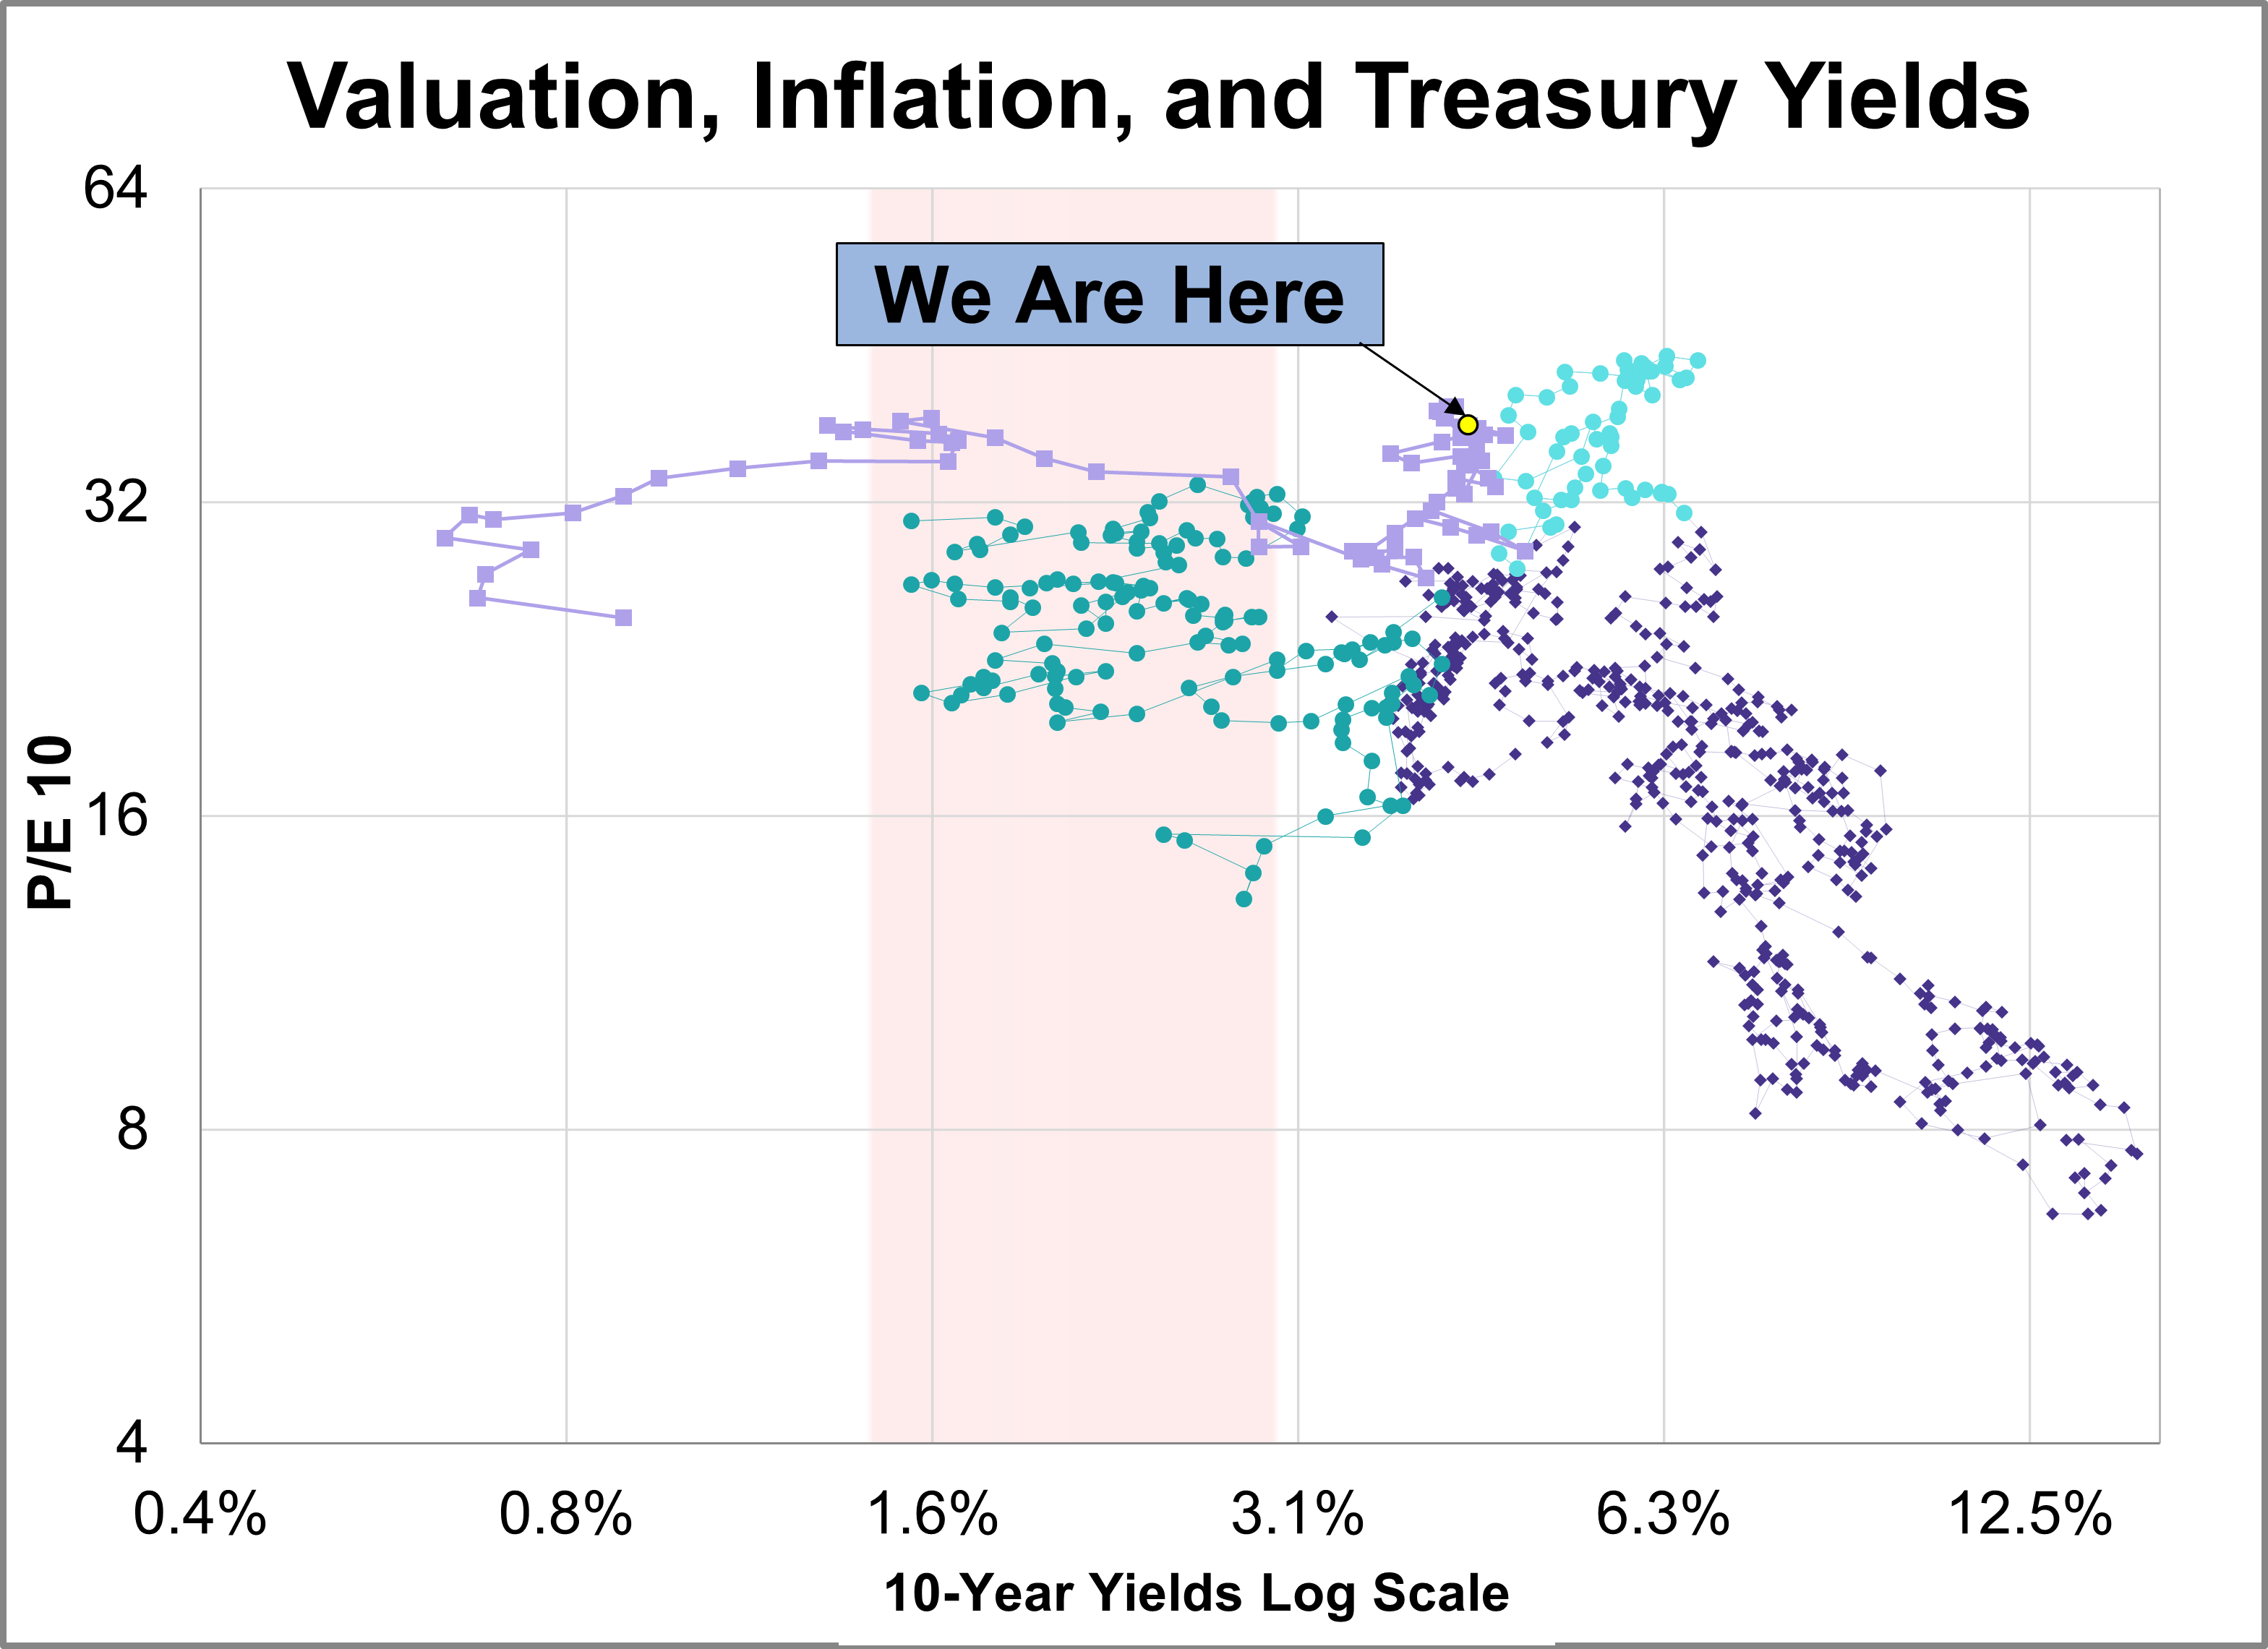
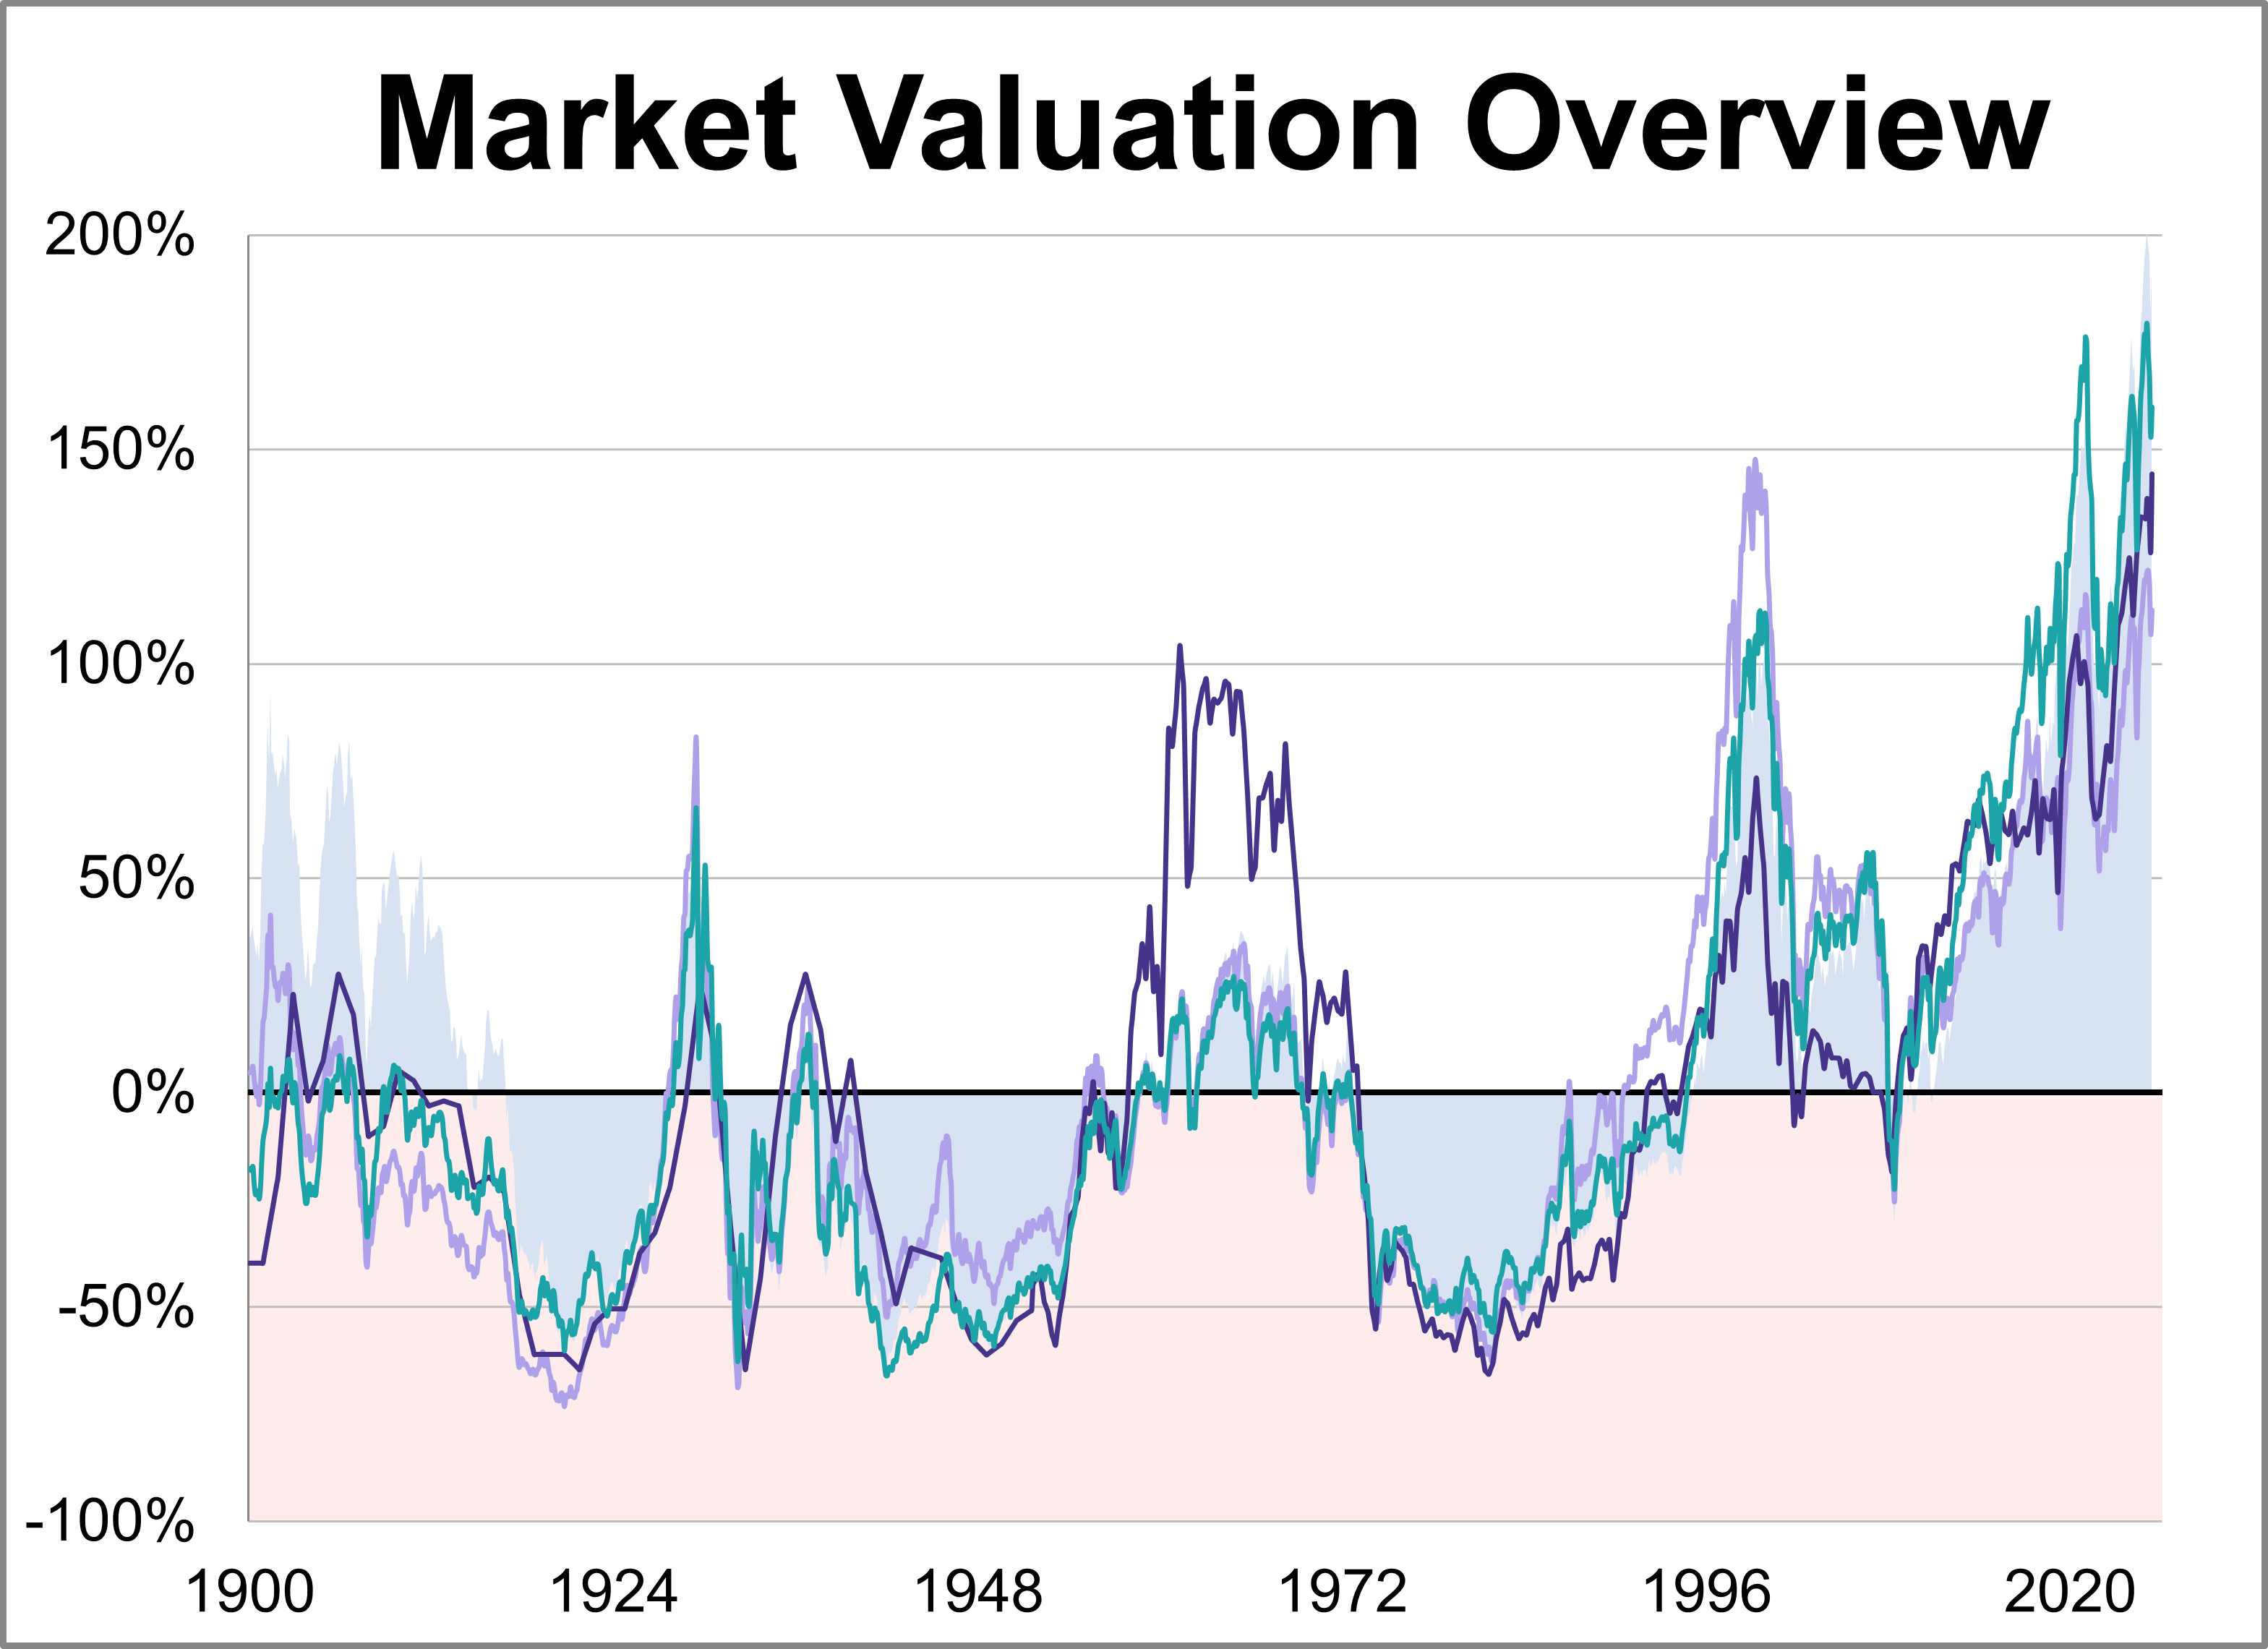
Our monthly market valuation updates have long had the same conclusion: US stock indexes are significantly overvalued, which suggests cautious expectations for investment returns. This analysis focuses on the P/E10 ratio, key indicator of market valuation, and its correlation with inflation and the 10-year Treasury yield.
Advisors are rethinking strategy in 2026, as geopolitics, AI adoption, and downside risk reshape market expectations and investment decisions.
Momentum and growth dominated in April 2026, driving the S&P 500 to a massive 10.5% return. Discover the data behind this risk-on shift.
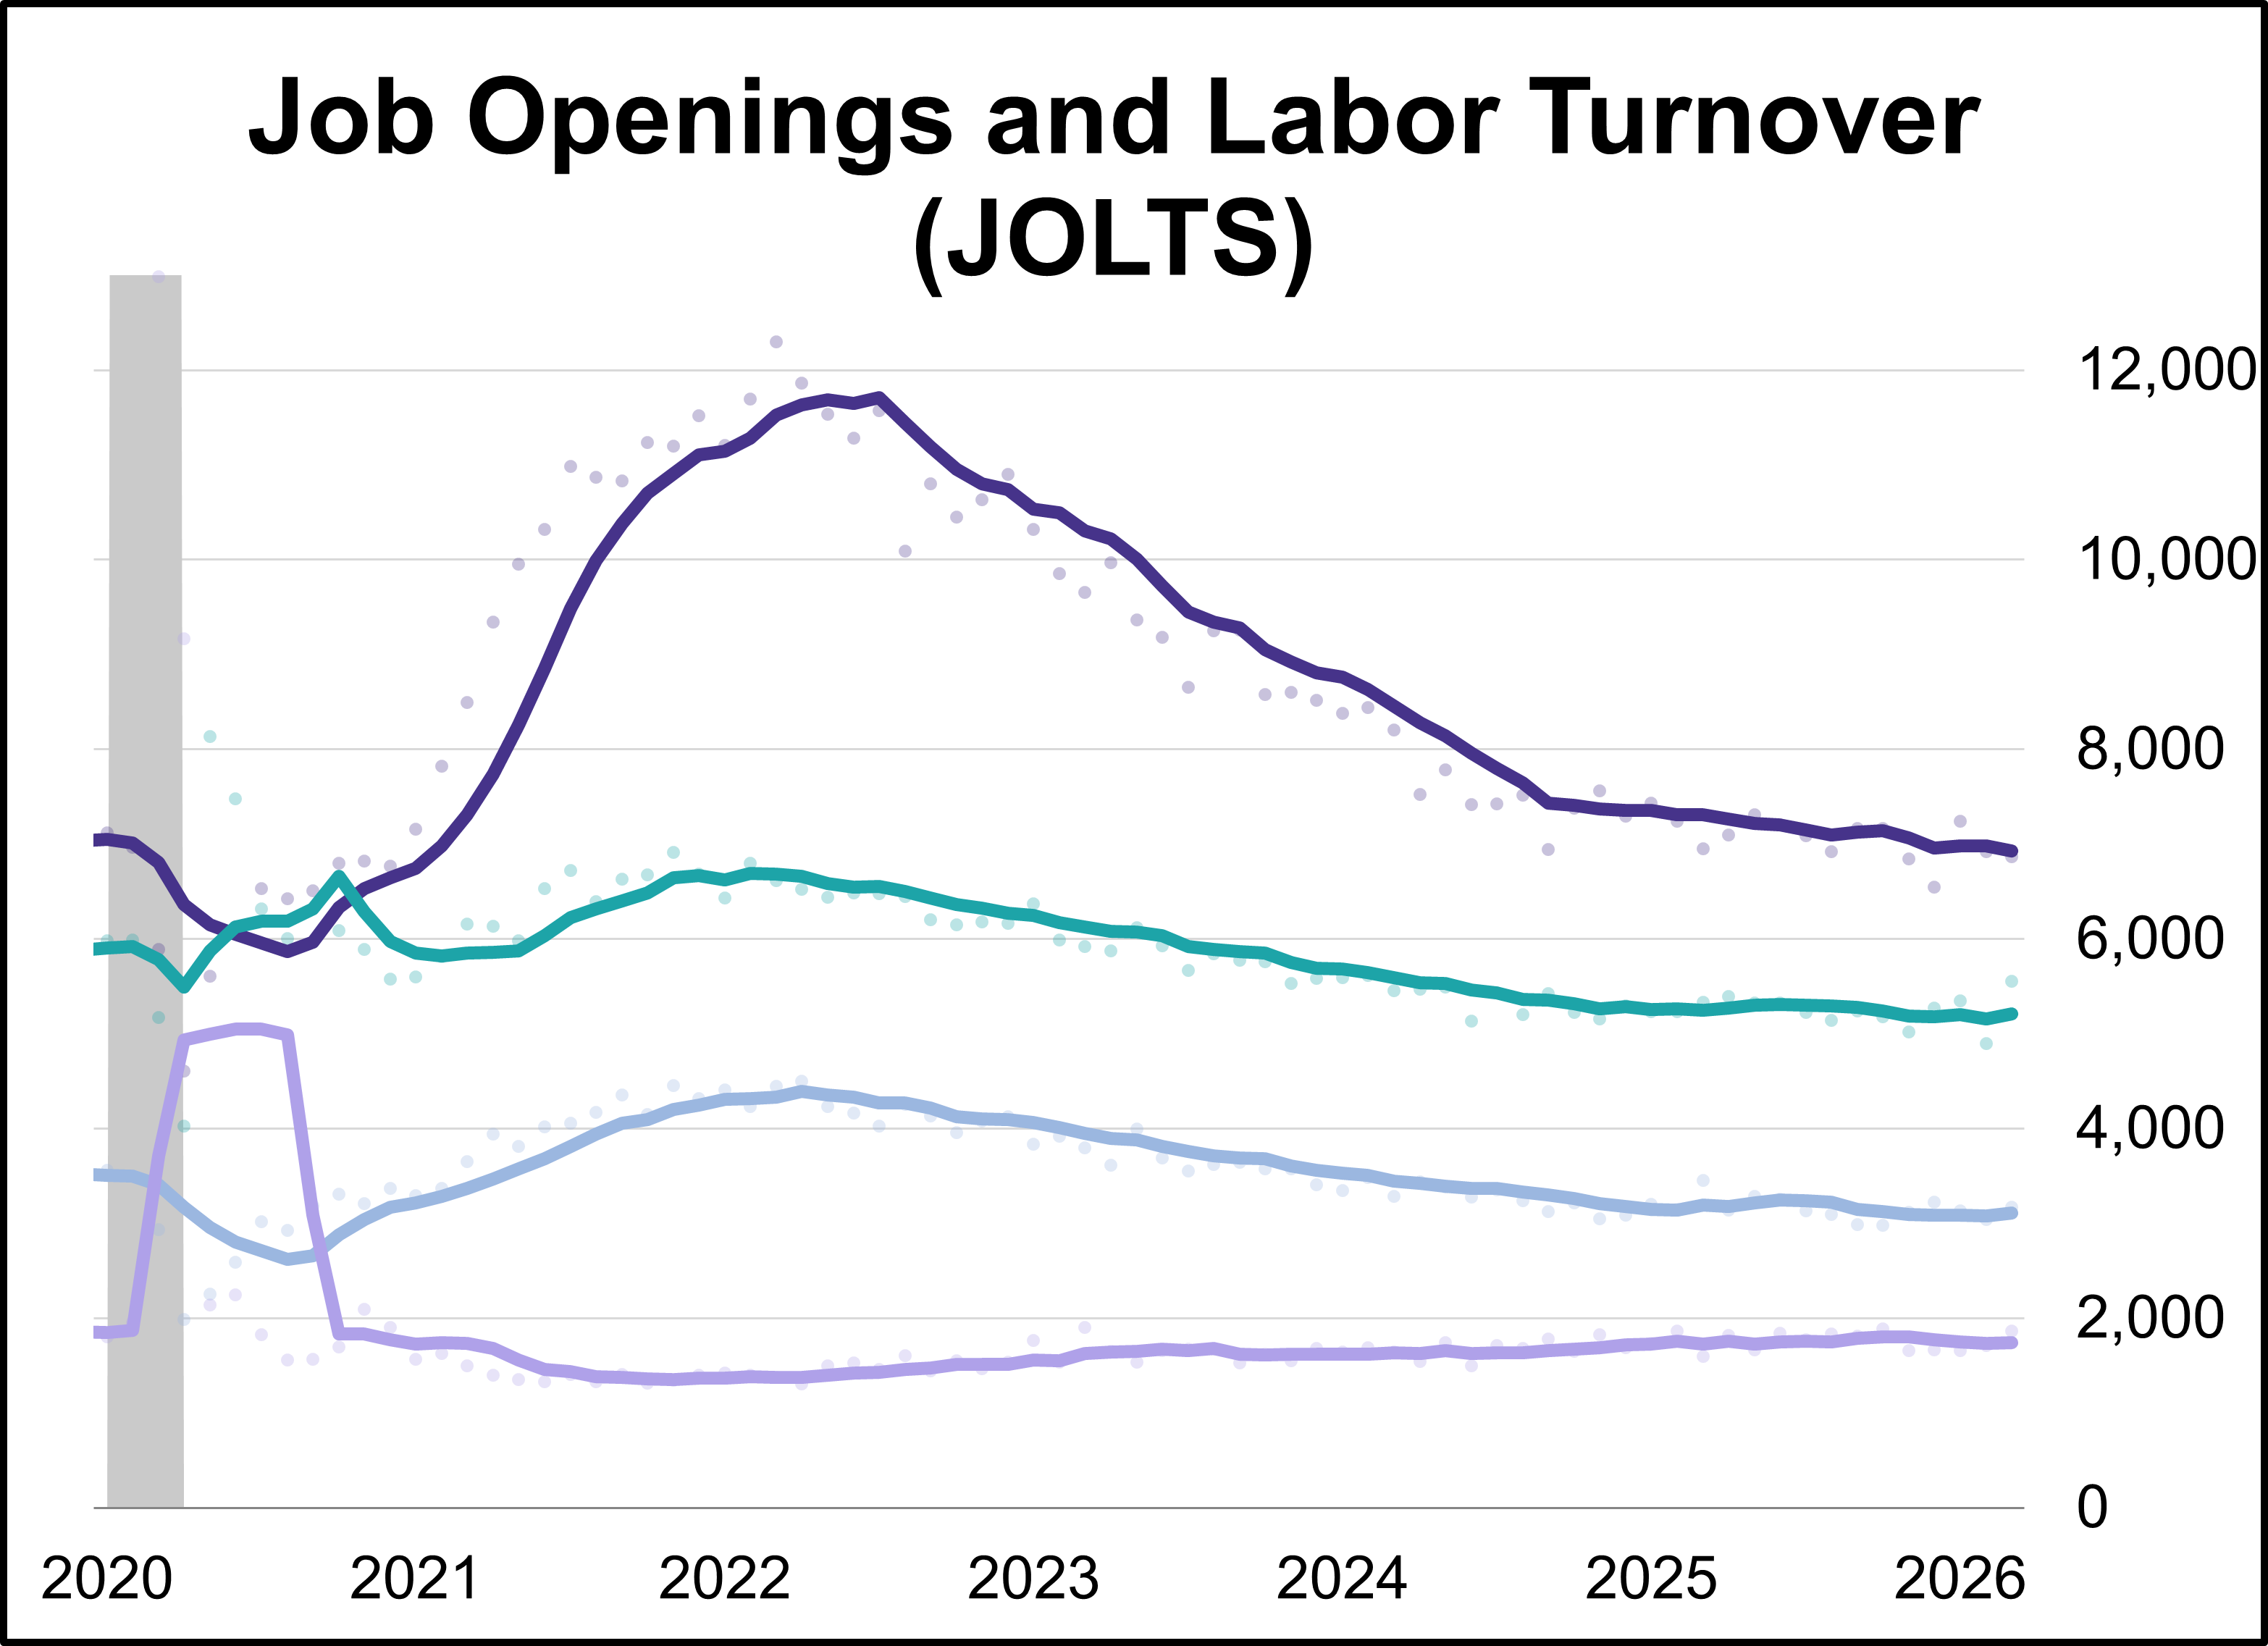
Job openings inched lower in March, settling at 6.866 million vacancies according to the latest Job Openings and Labor Turnover Survey (JOLTS). This represents a decrease of 56,000 from the previous month, the fourth decline in the last five months.
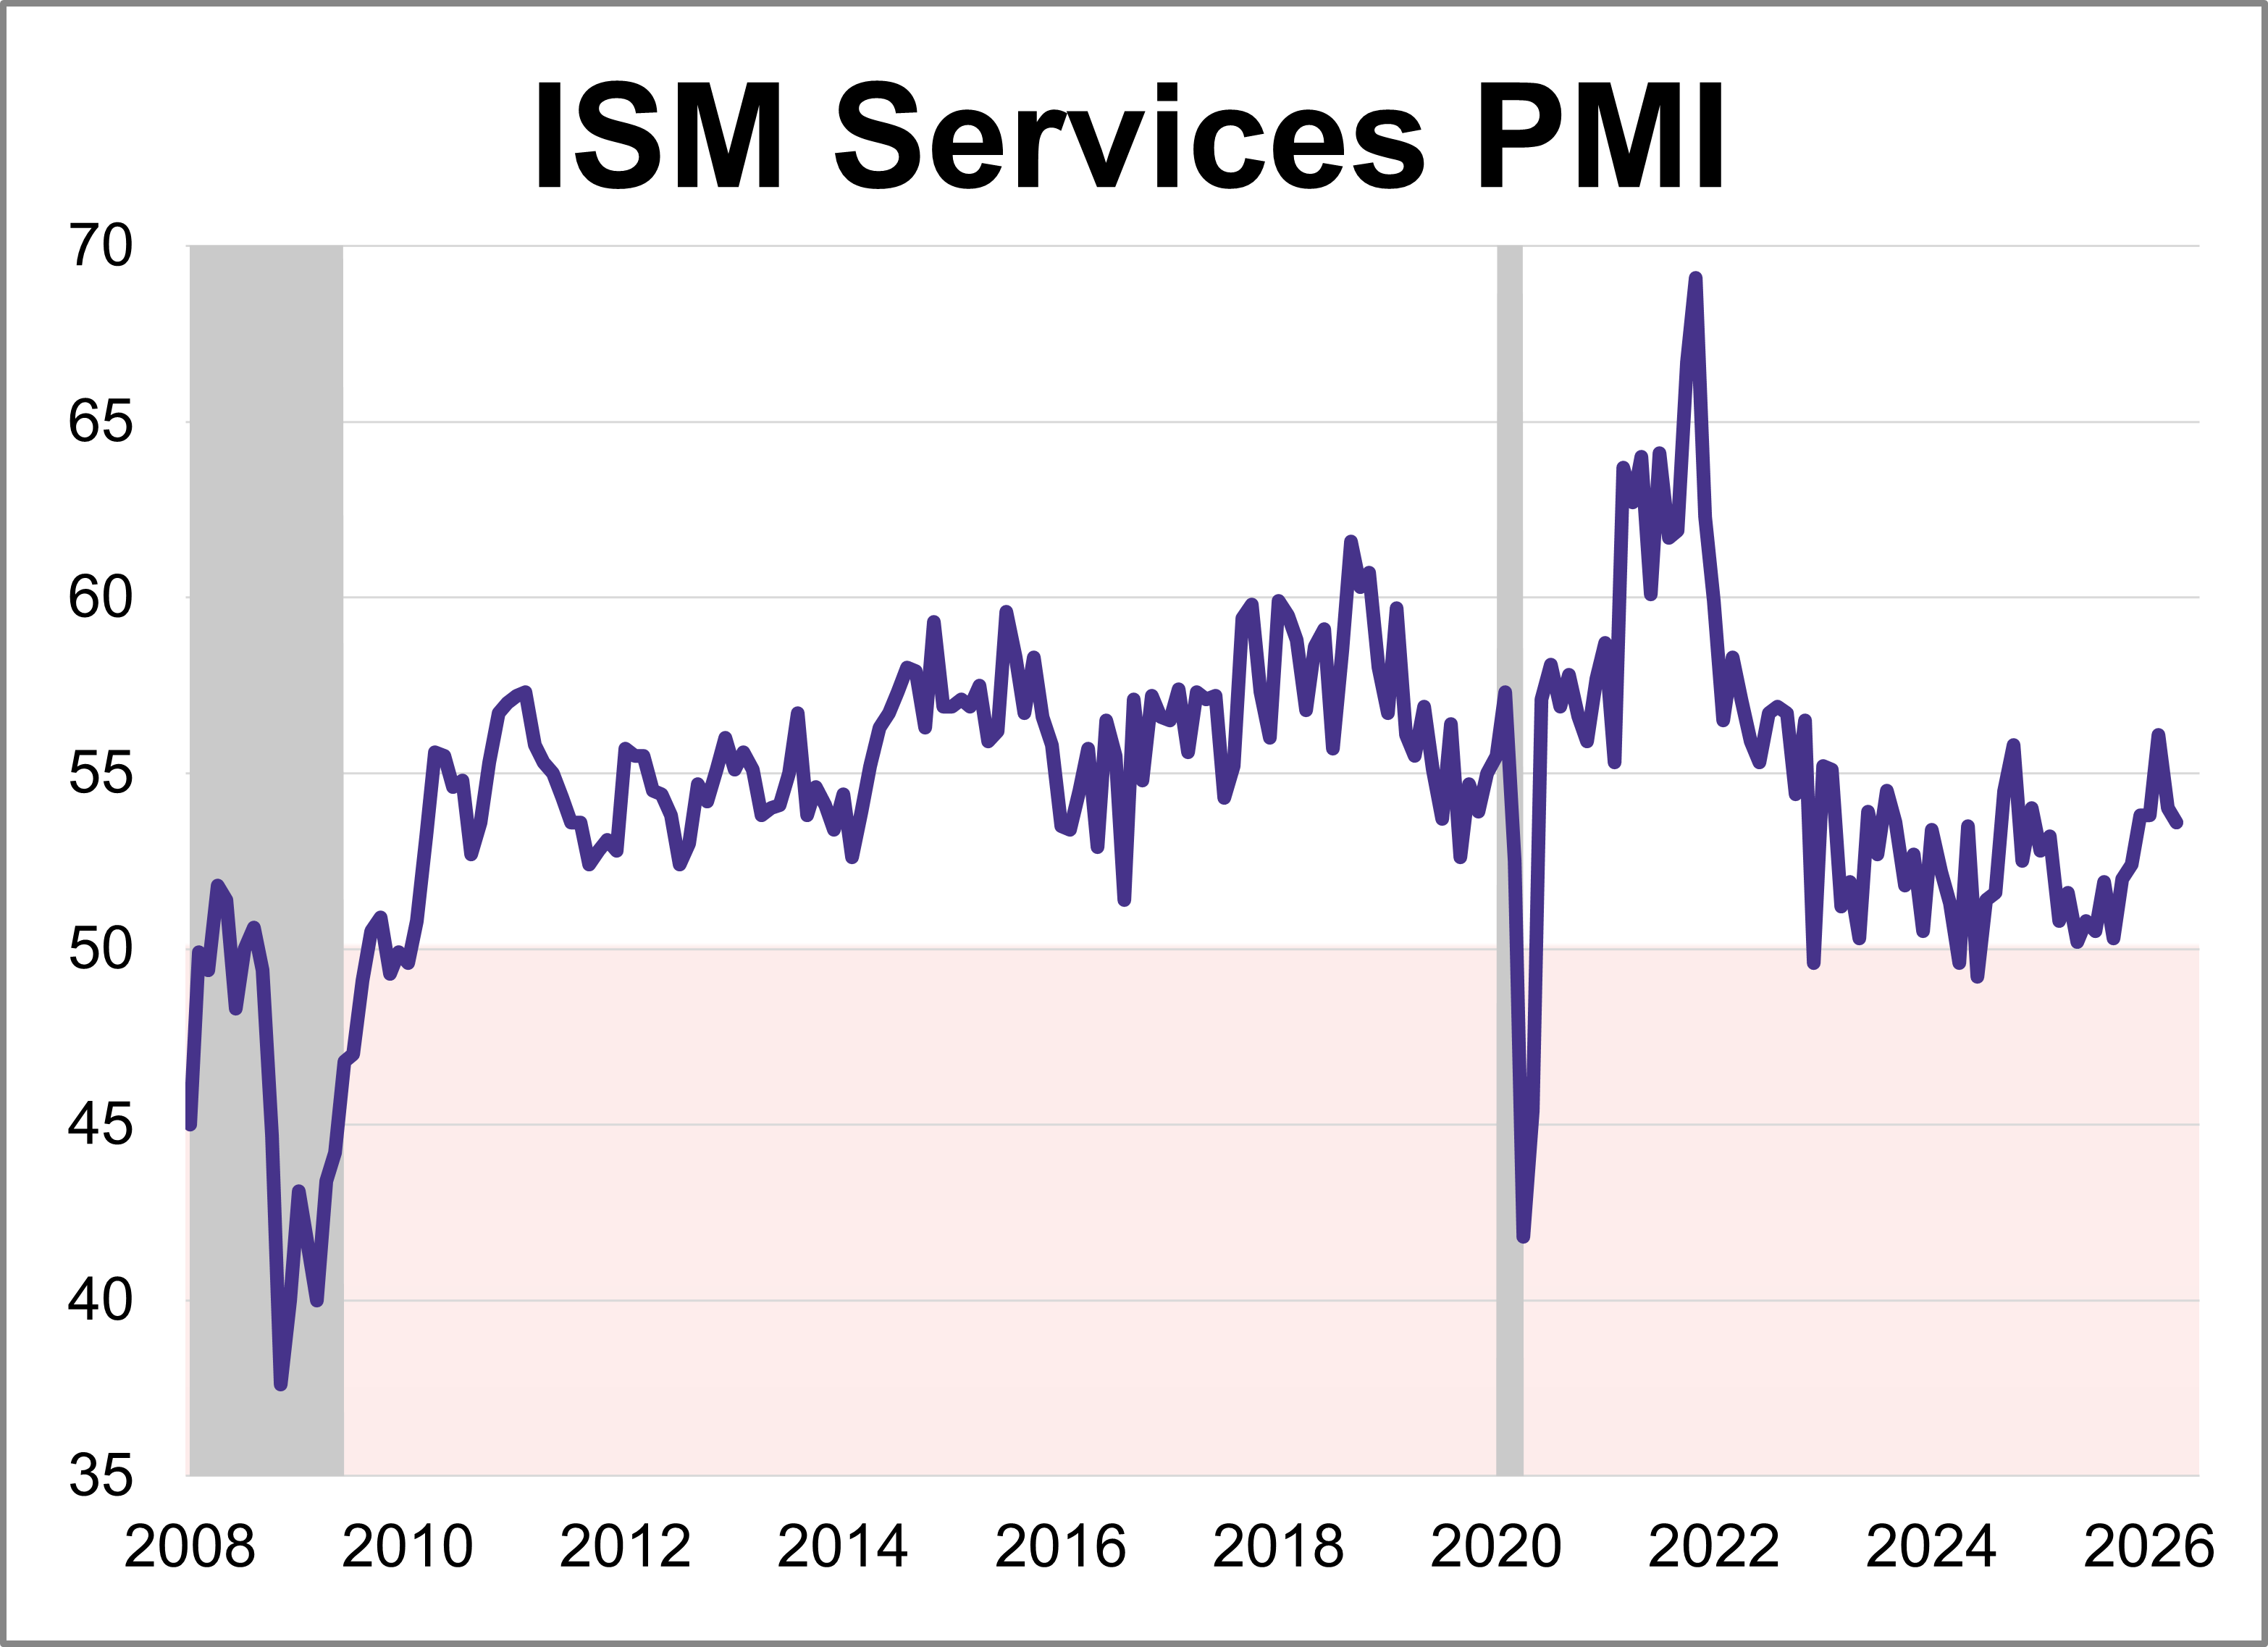
The Institute for Supply Management (ISM) released its April Services Purchasing Managers' Index (PMI), with the headline composite index at 53.6. This was lower than the forecast of 53.7 but keeps the index in expansion territory for a 22nd consecutive month.
The April U.S. Services Purchasing Managers' Index (PMI) from S&P Global rose 1.2 points to 51.0, indicating marginal improvement in the services sector. The latest reading was lower than the forecast of 51.3.
The U.S. trade deficit expanded over 4% in March to $60.31B after expanding nearly 6% the previous month. The latest reading barely missed the forecast of -$61.00B.
Here is a summary of the four market valuation indicators we update on a monthly basis.
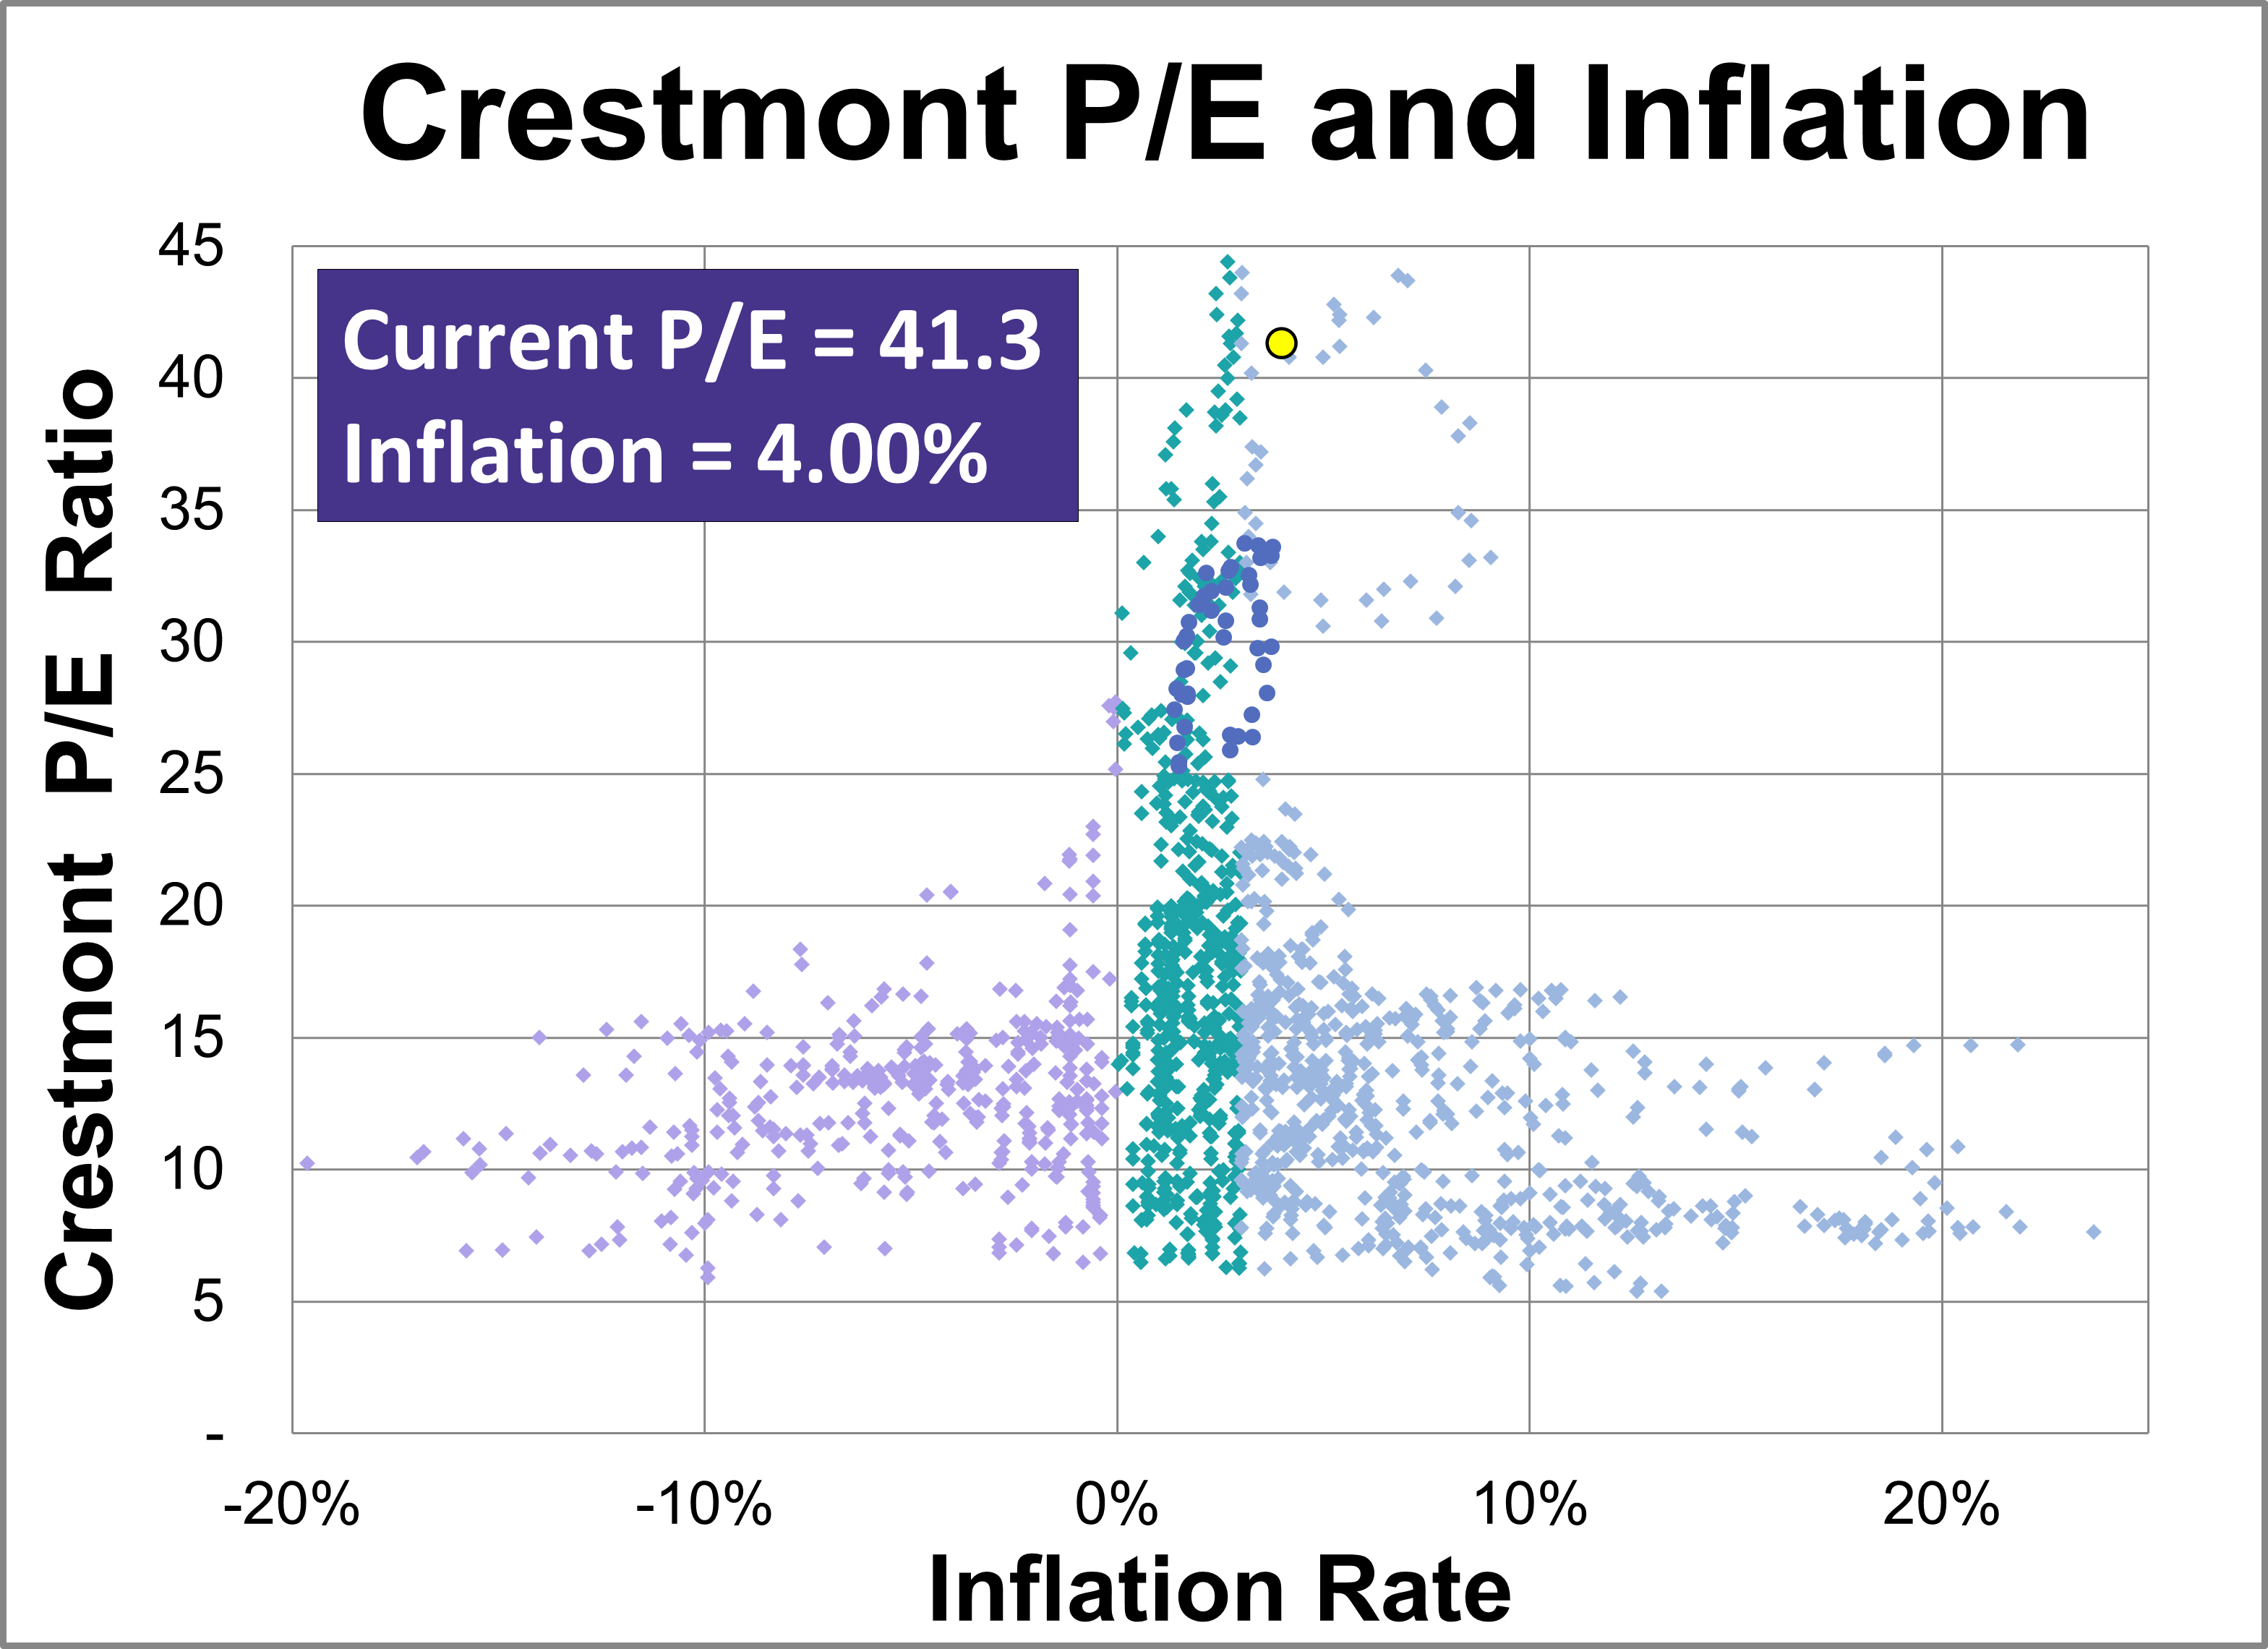
Based on April's S&P 500 average of daily closes, the Crestmont P/E of 41.3 is 169% above its arithmetic mean, 195% above its geometric mean, and is in the 99th percentile of this 14-plus-decade series.
The Q Ratio is the total price of the market divided by the replacement cost of all its companies. As of April 2026, the latest Q-ratio is at 2.07, the highest level in history.
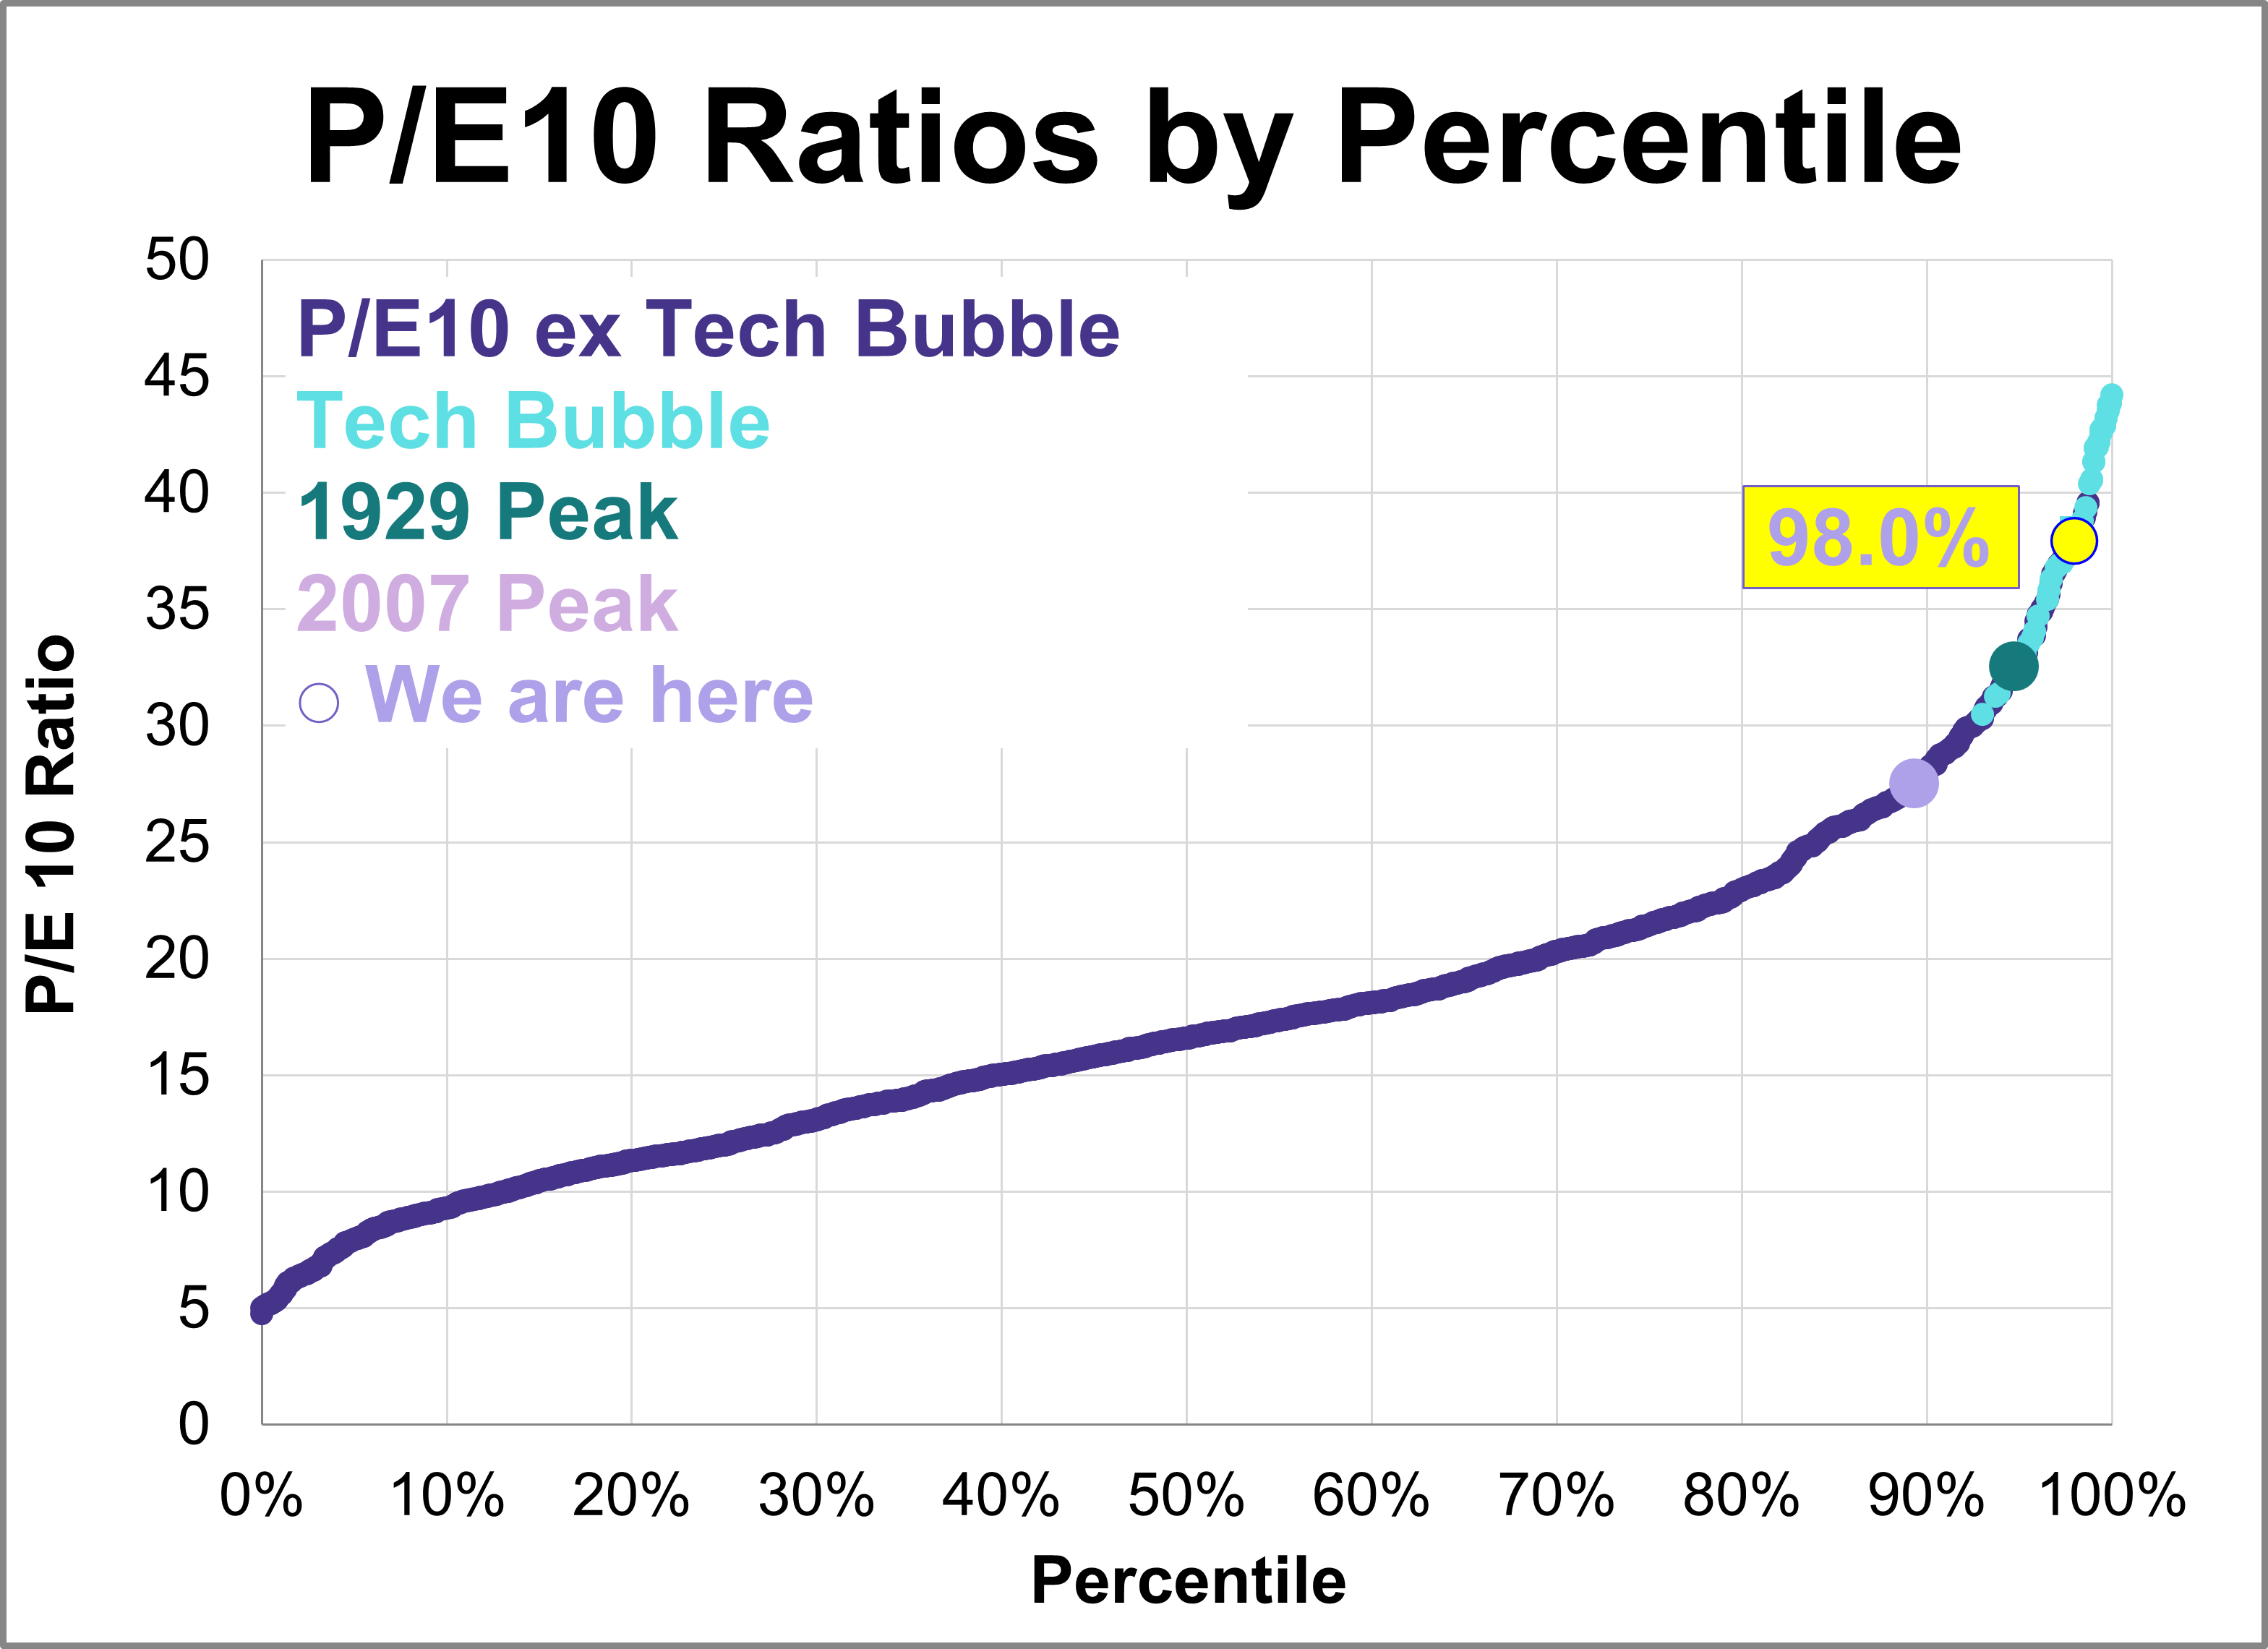
Here is the latest update of a popular market valuation method, Price-to-Earnings (P/E) ratio, using the most recent Standard & Poor's "as reported" earnings and earnings estimates, and the index monthly average of daily closes for the past month. The latest trailing twelve months (TTM) P/E ratio is 24.8 and the latest P/E10 ratio is 37.9.
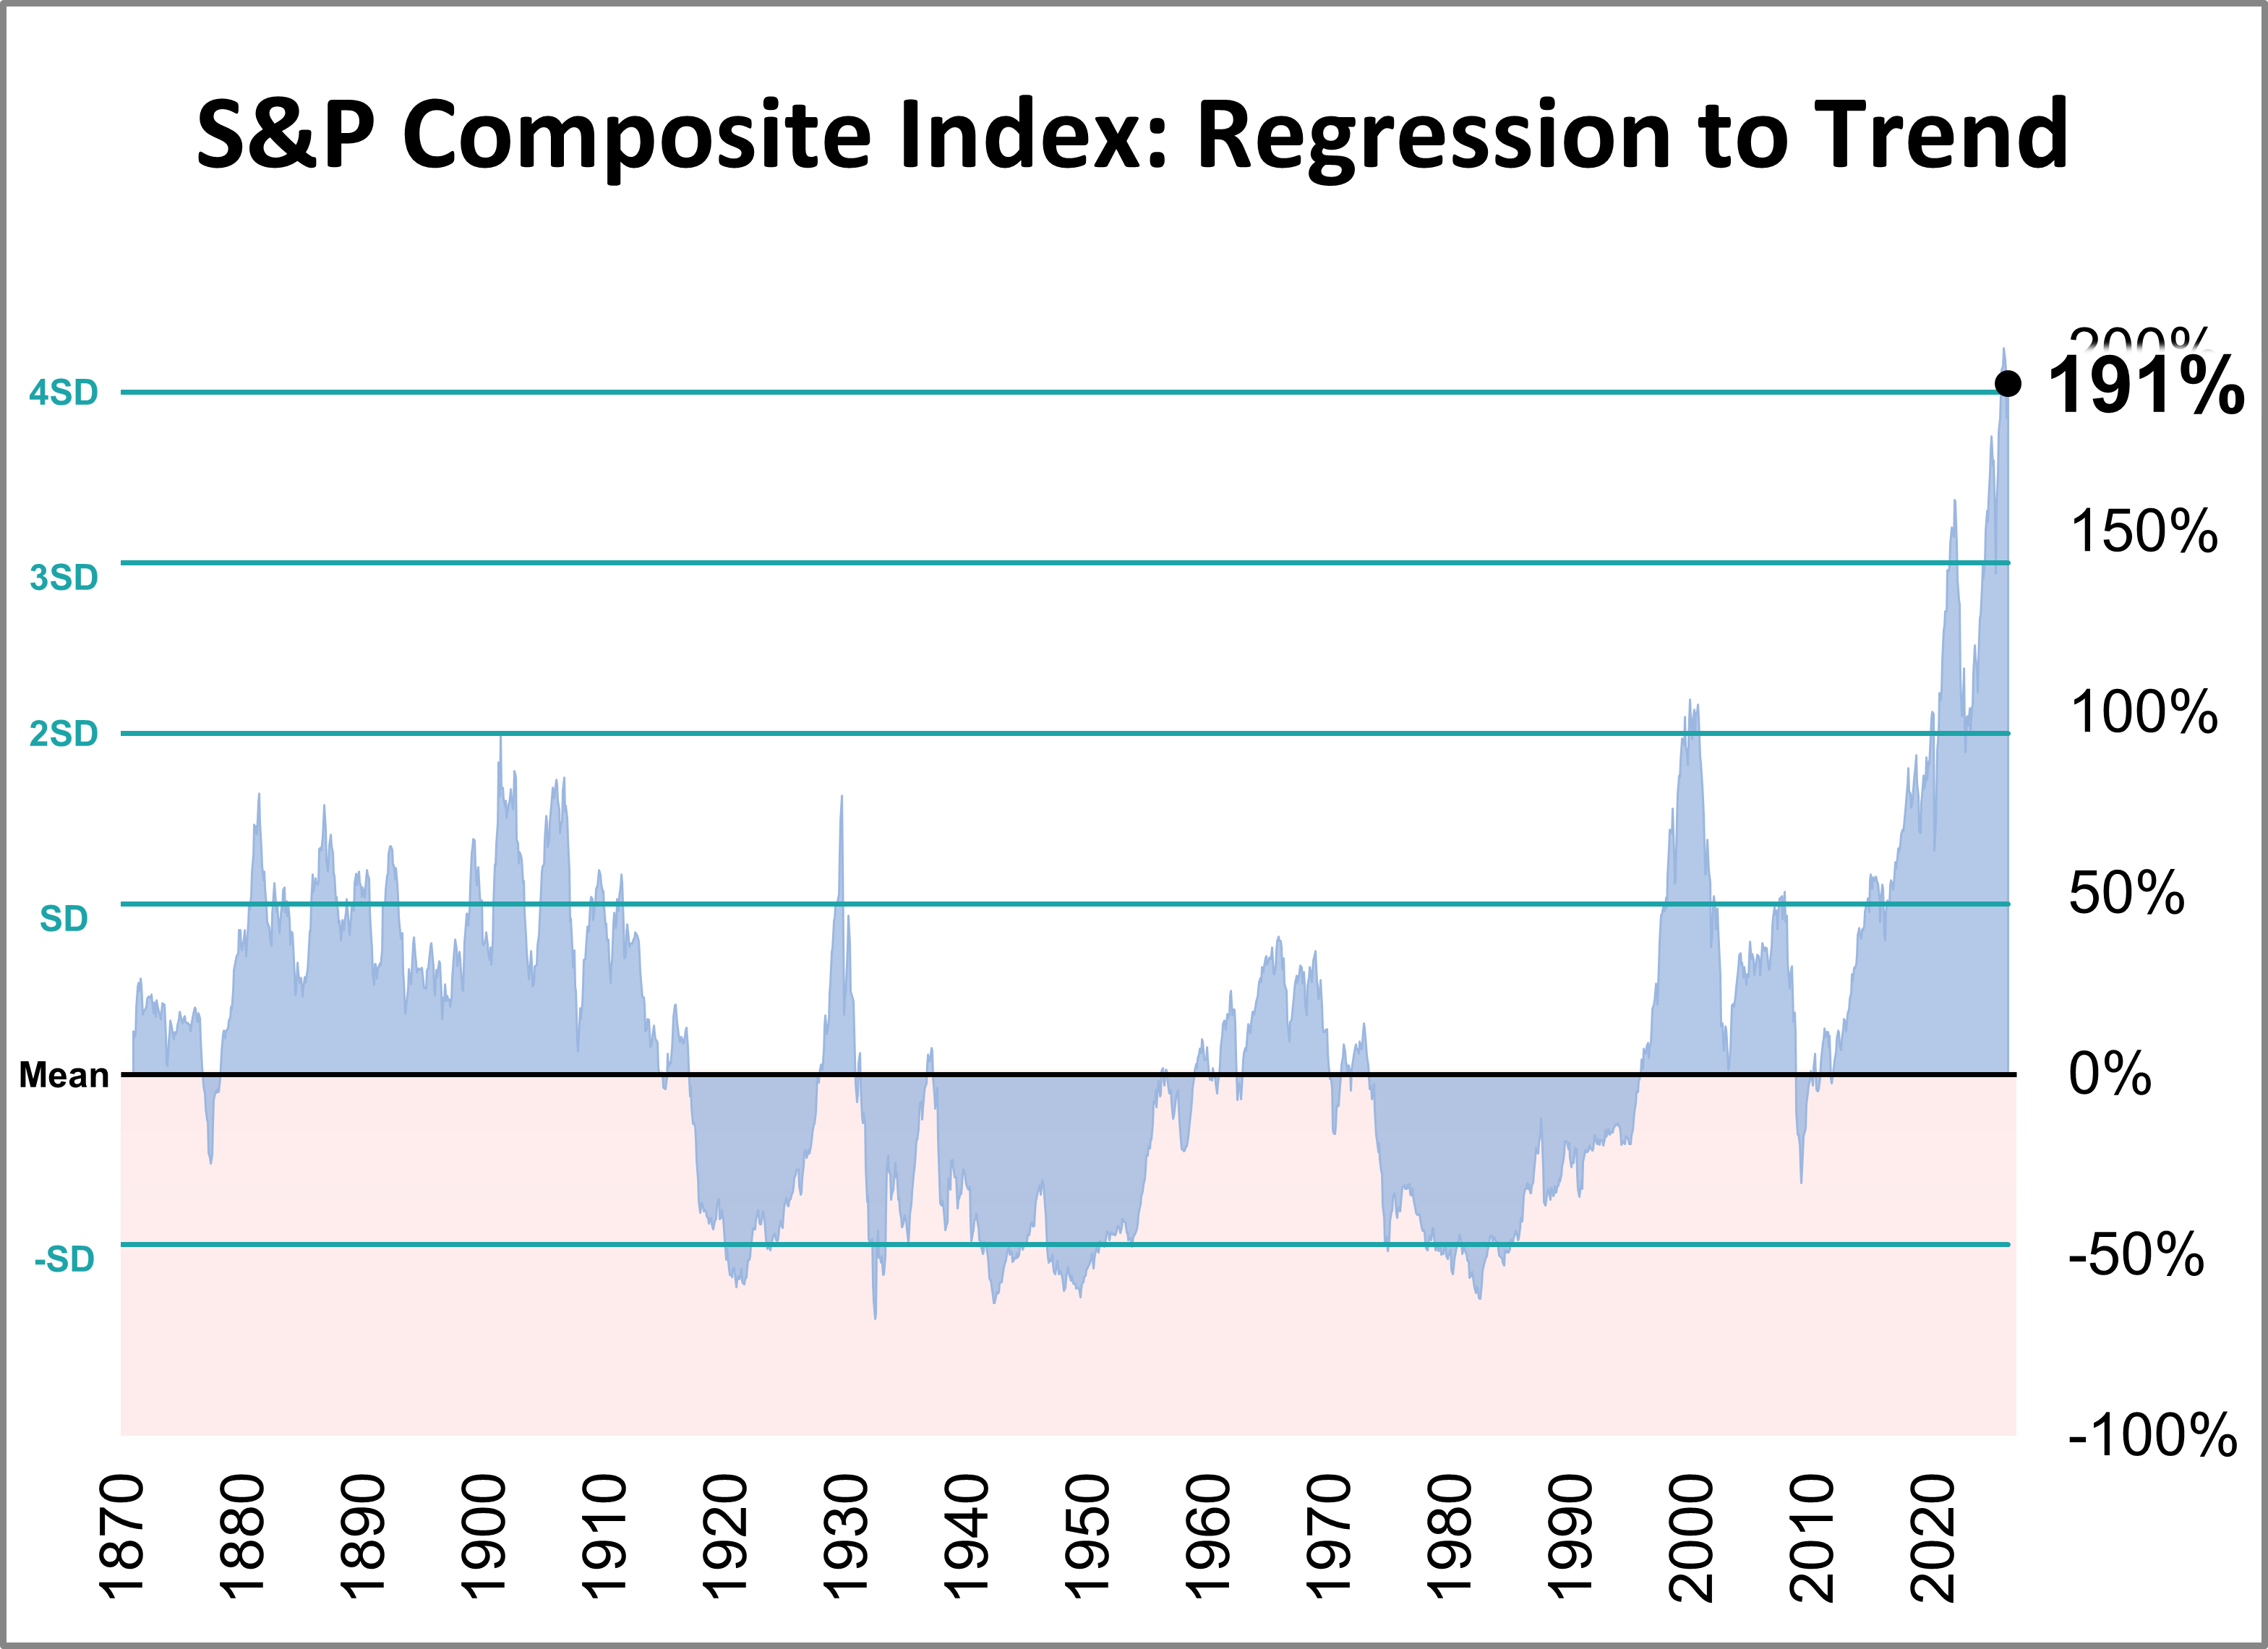
The inflation-adjusted S&P Composite Index was 191% above its long-term trend at the end of April.
The U.S. economy ended April with mixed signals: steady interest rates and high Fed dissent met persistent, energy-driven inflation. Despite these hurdles, accelerated Q1 growth and rising consumer confidence provided a buffer against ongoing global instability.
Volatility ETFs have specific purposes to fulfill for investors -- so have they done so in a very volatile year?
The Institute for Supply Management (ISM) manufacturing purchasing managers index (PMI) came in at 52.7 in April, unchanged from March and marking the fastest expansion for the index since August 2022. The latest reading was lower than the 53.1 forecast and is the index's fourth straight month in expansion territory.
U.S. manufacturing hit a nearly four-year high in April, as the S&P Global PMI climbed 2.2 points to 54.5. This expansion was largely driven by defensive stockpiling as companies braced for supply disruptions and price hikes linked to conflict in the Middle East.
The 10-year Treasury yield has experienced dramatic fluctuations, ranging from a peak of 15.68% in October 1981, during the height of the Volcker era, to a historic low of 0.55% in August 2020, amidst the economic uncertainty of the pandemic. At the end of April 2026, the weekly average stood at 4.30%.
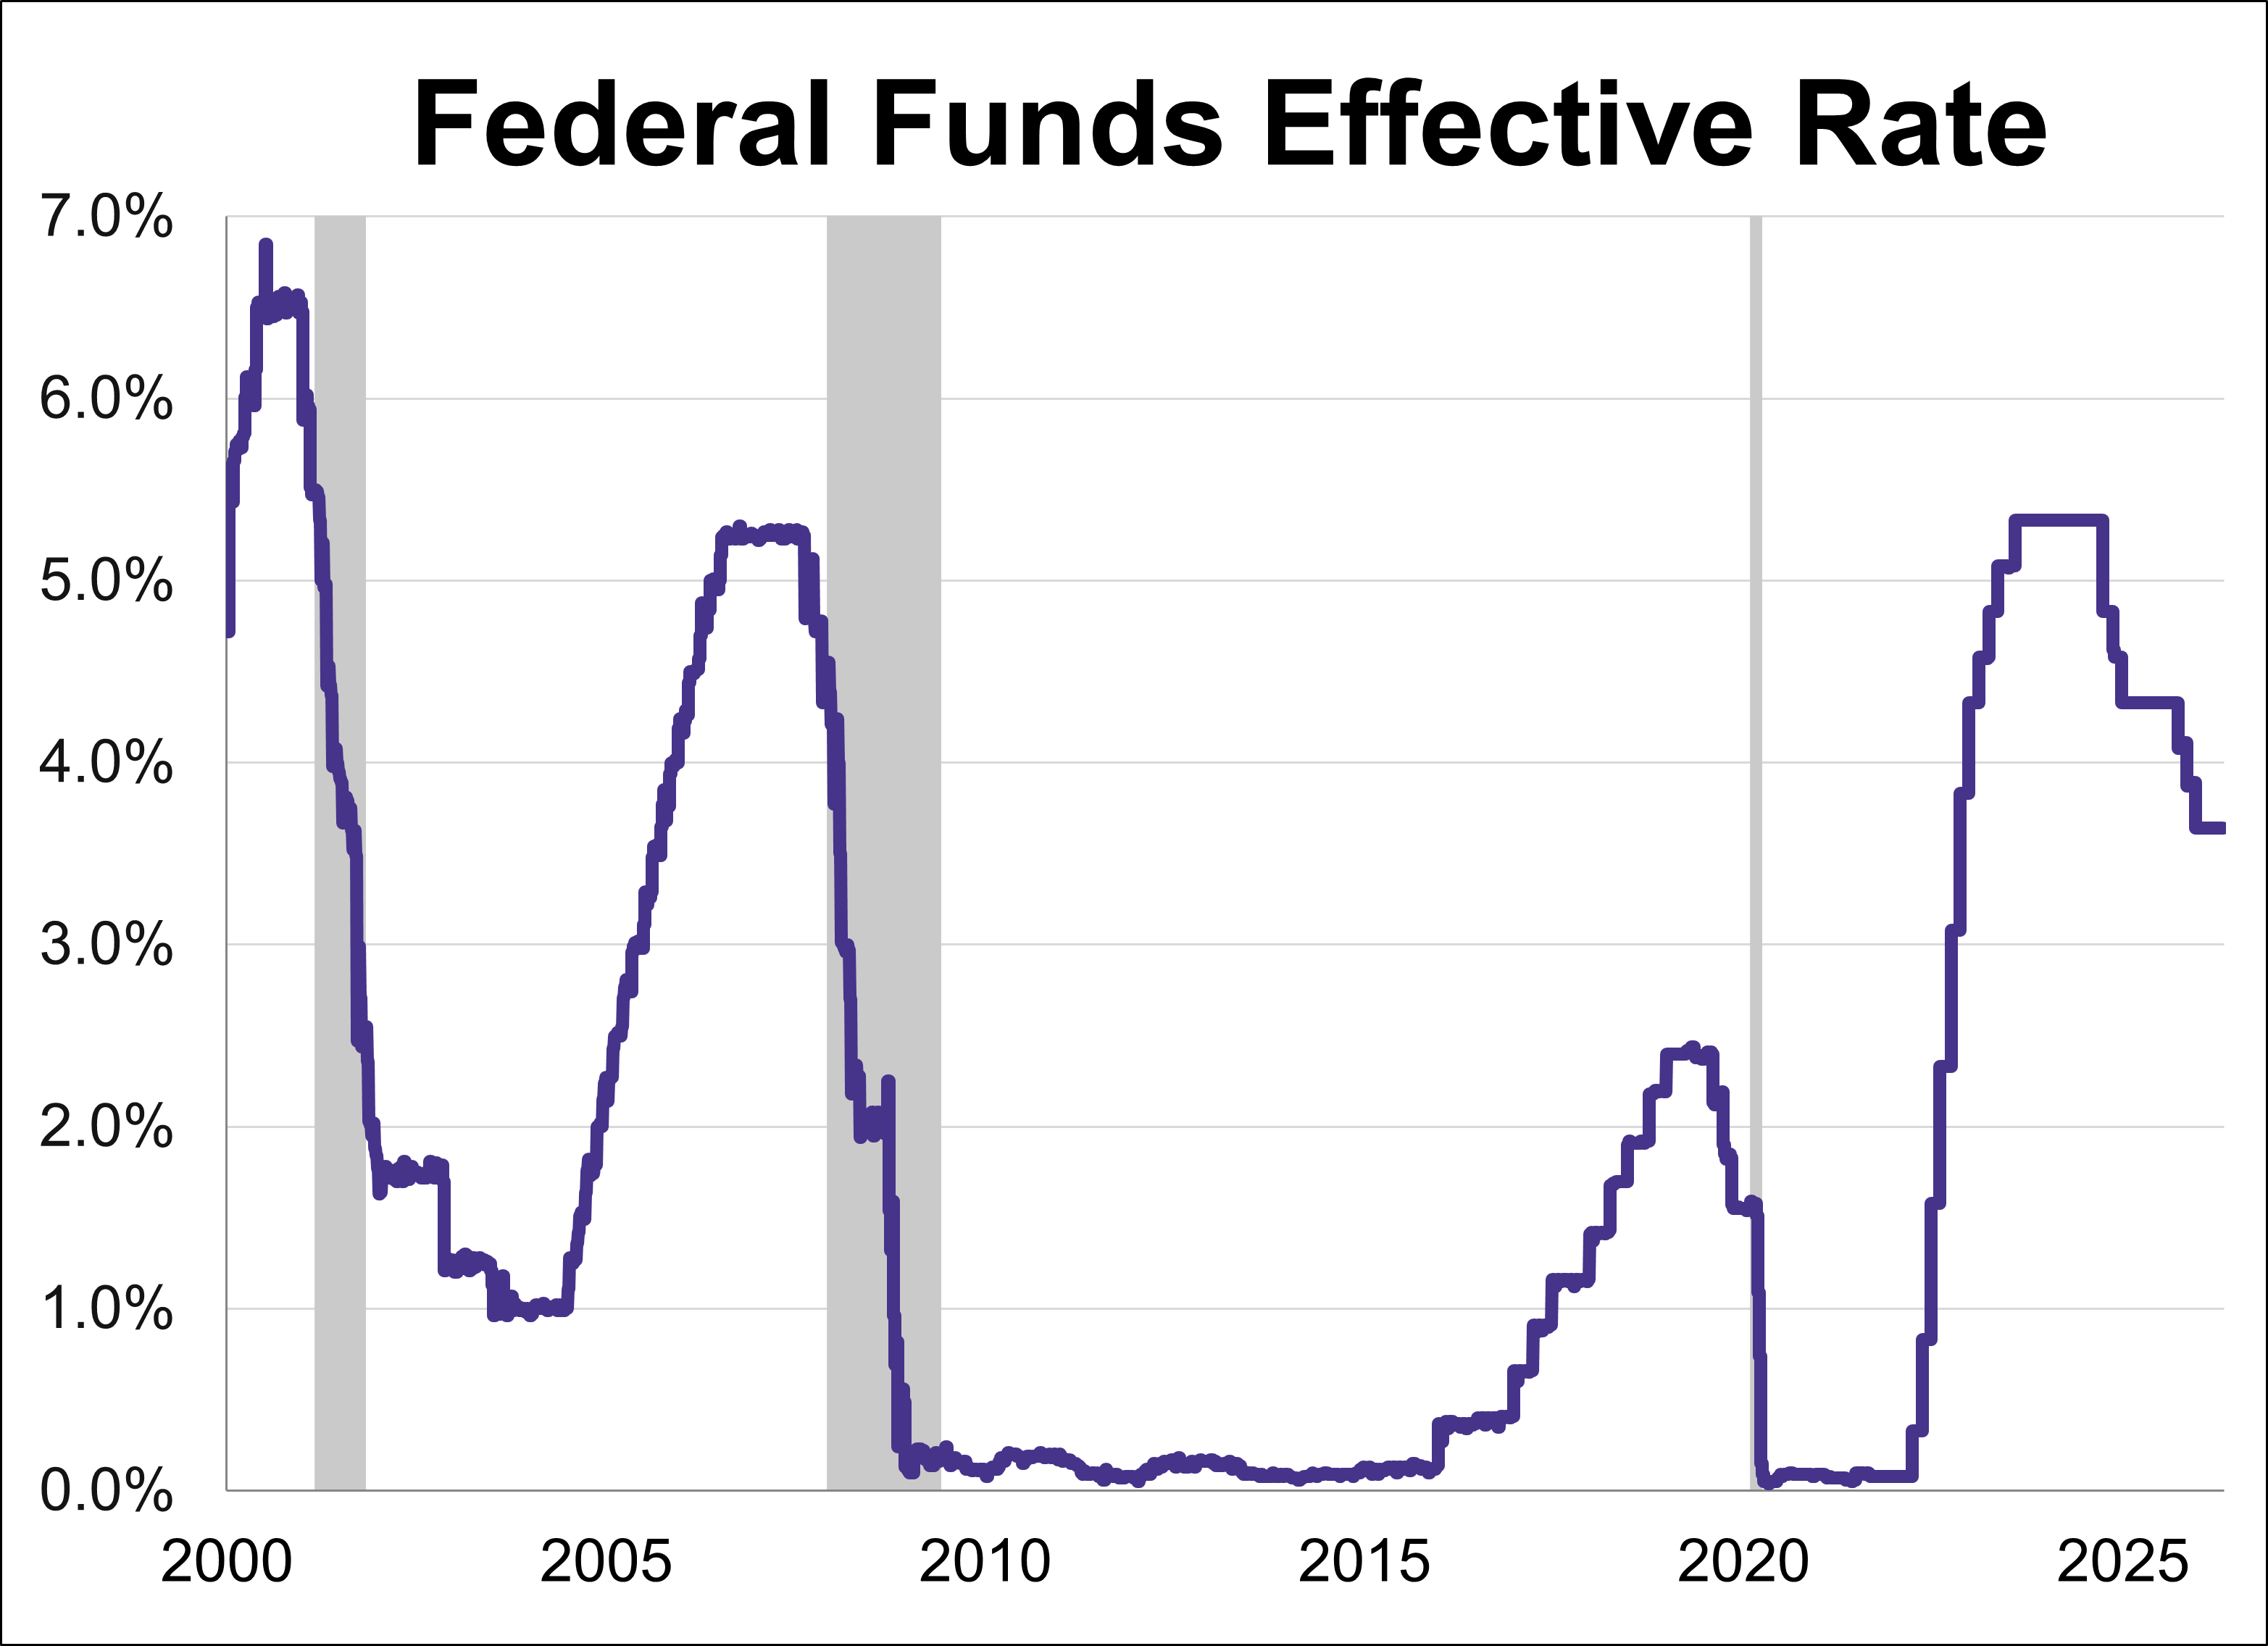
The Federal Reserve concluded its third meeting of the year by holding the federal funds rate (FFR) steady in the 3.50%-3.75% range.
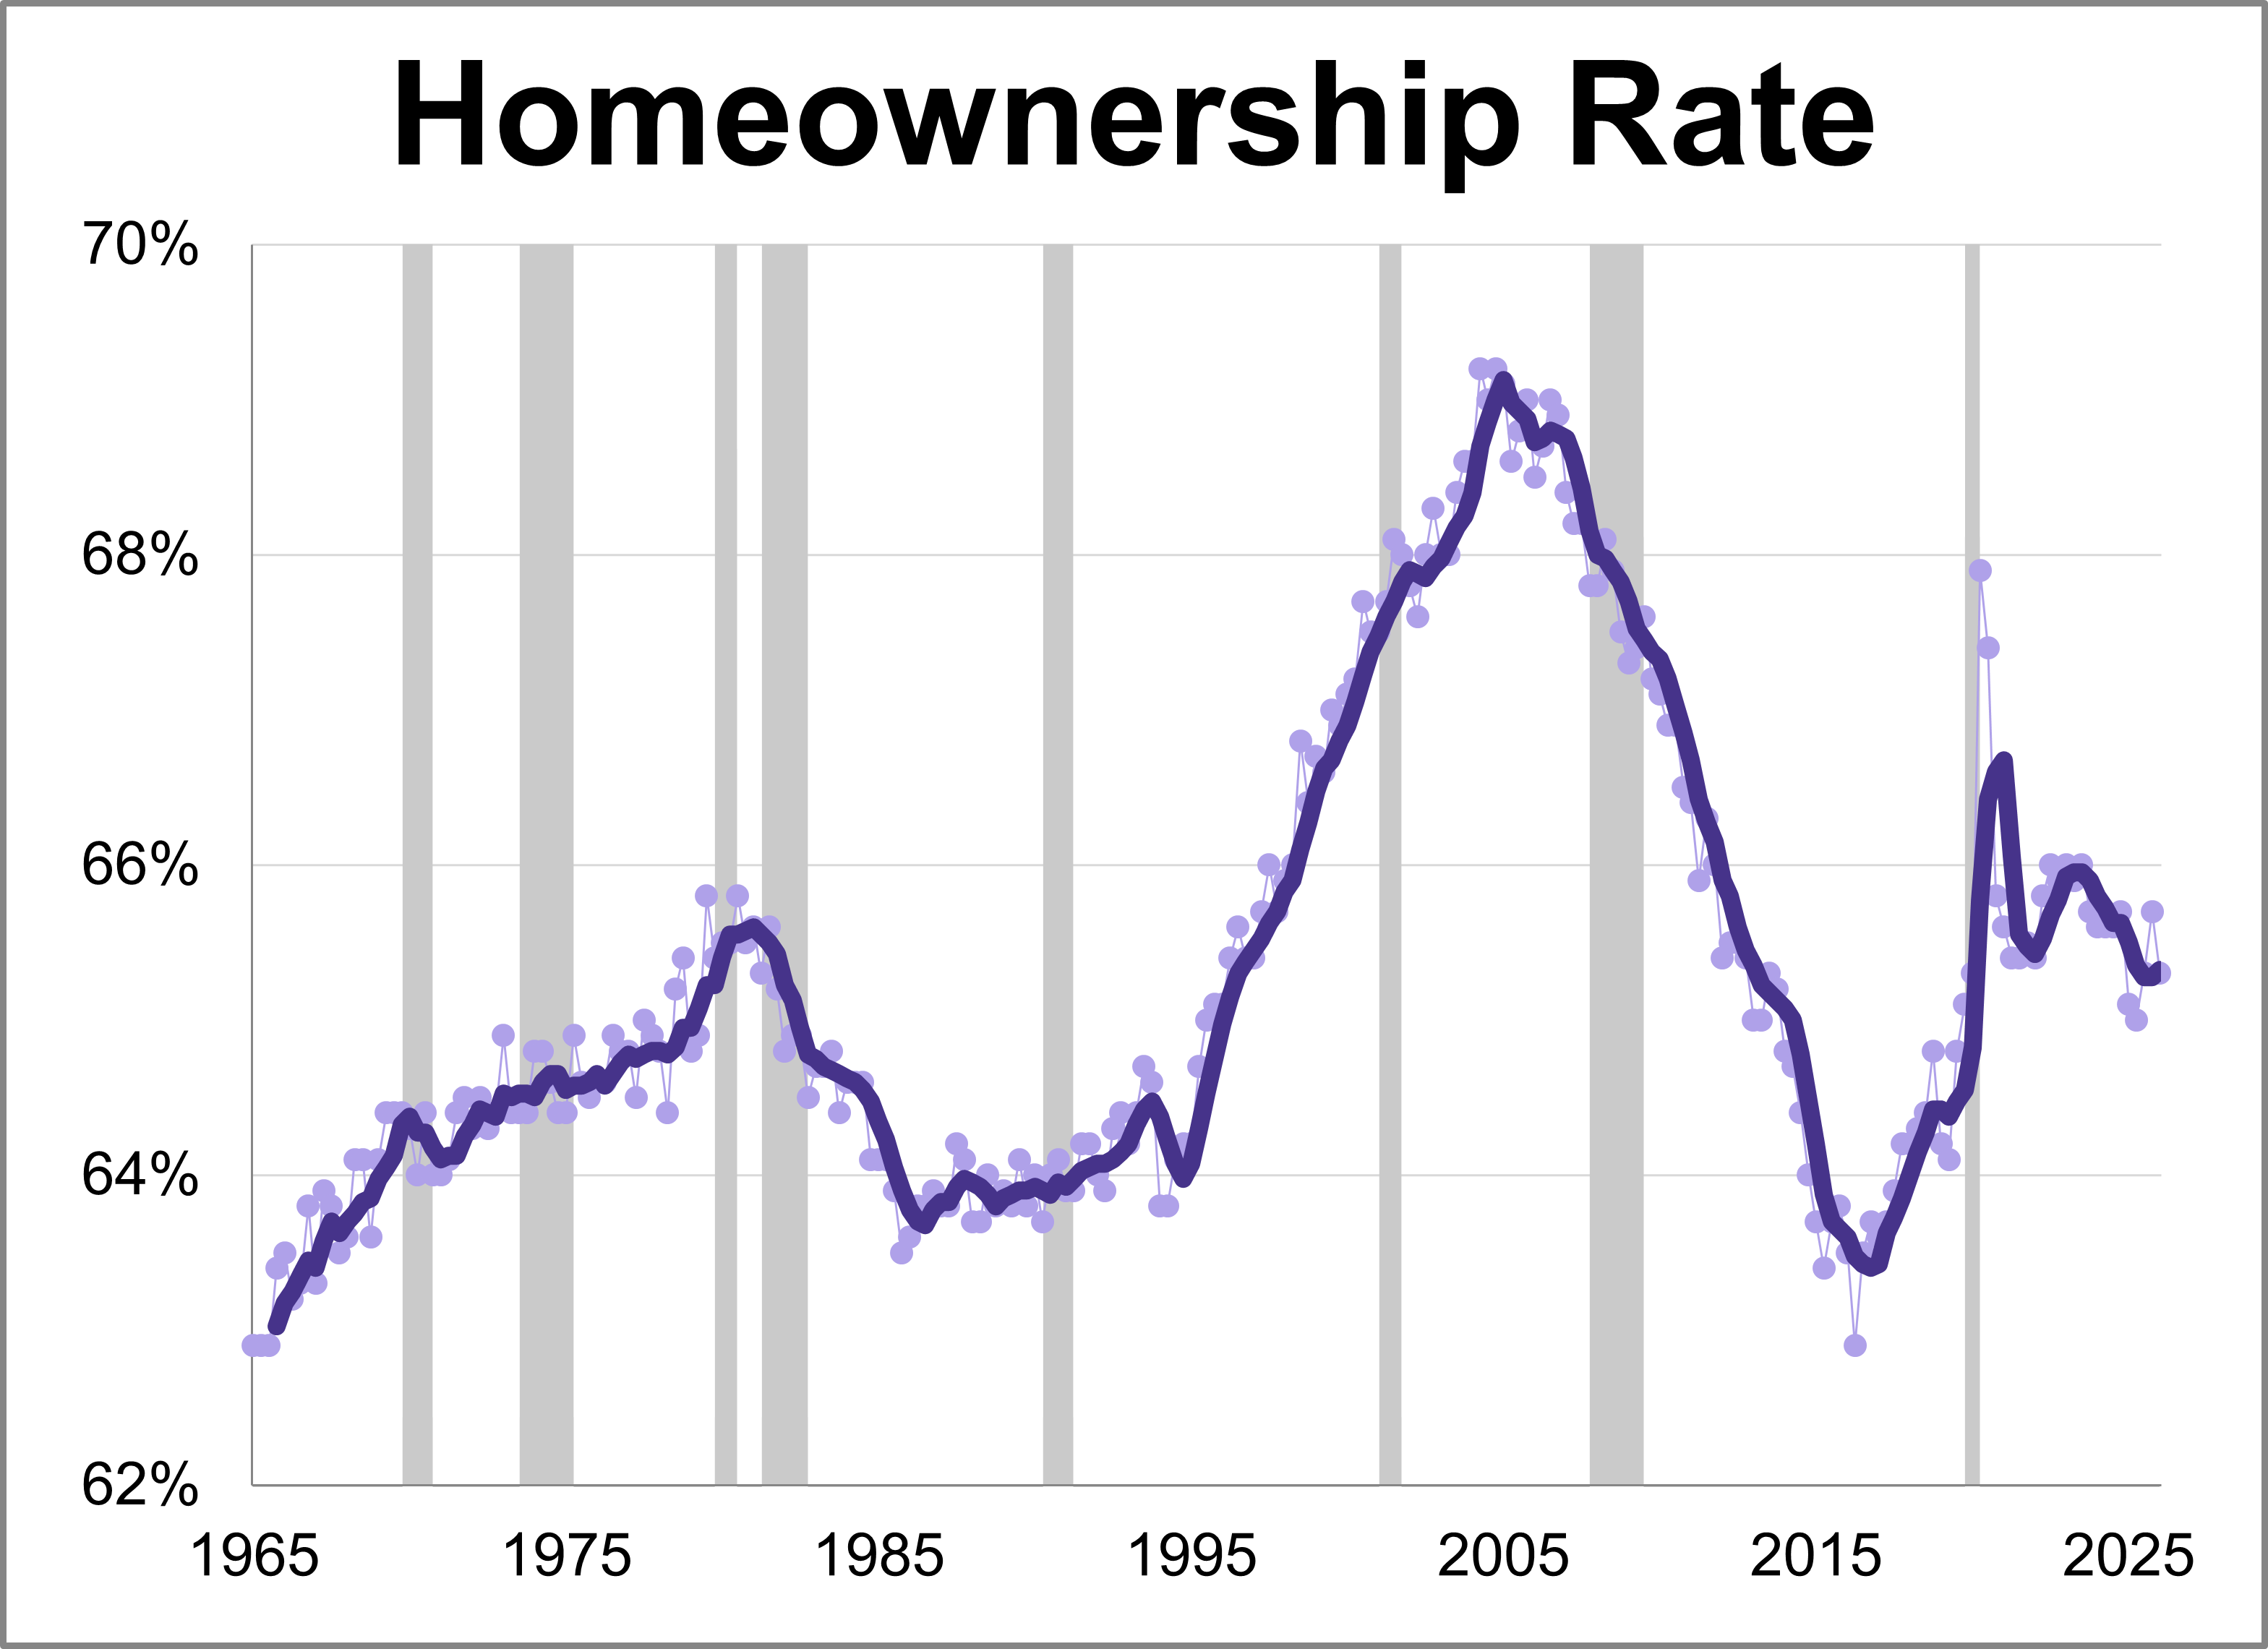
The Census Bureau released its latest quarterly report for Q1 2026 showing the latest homeownership rate is at 65.3%.
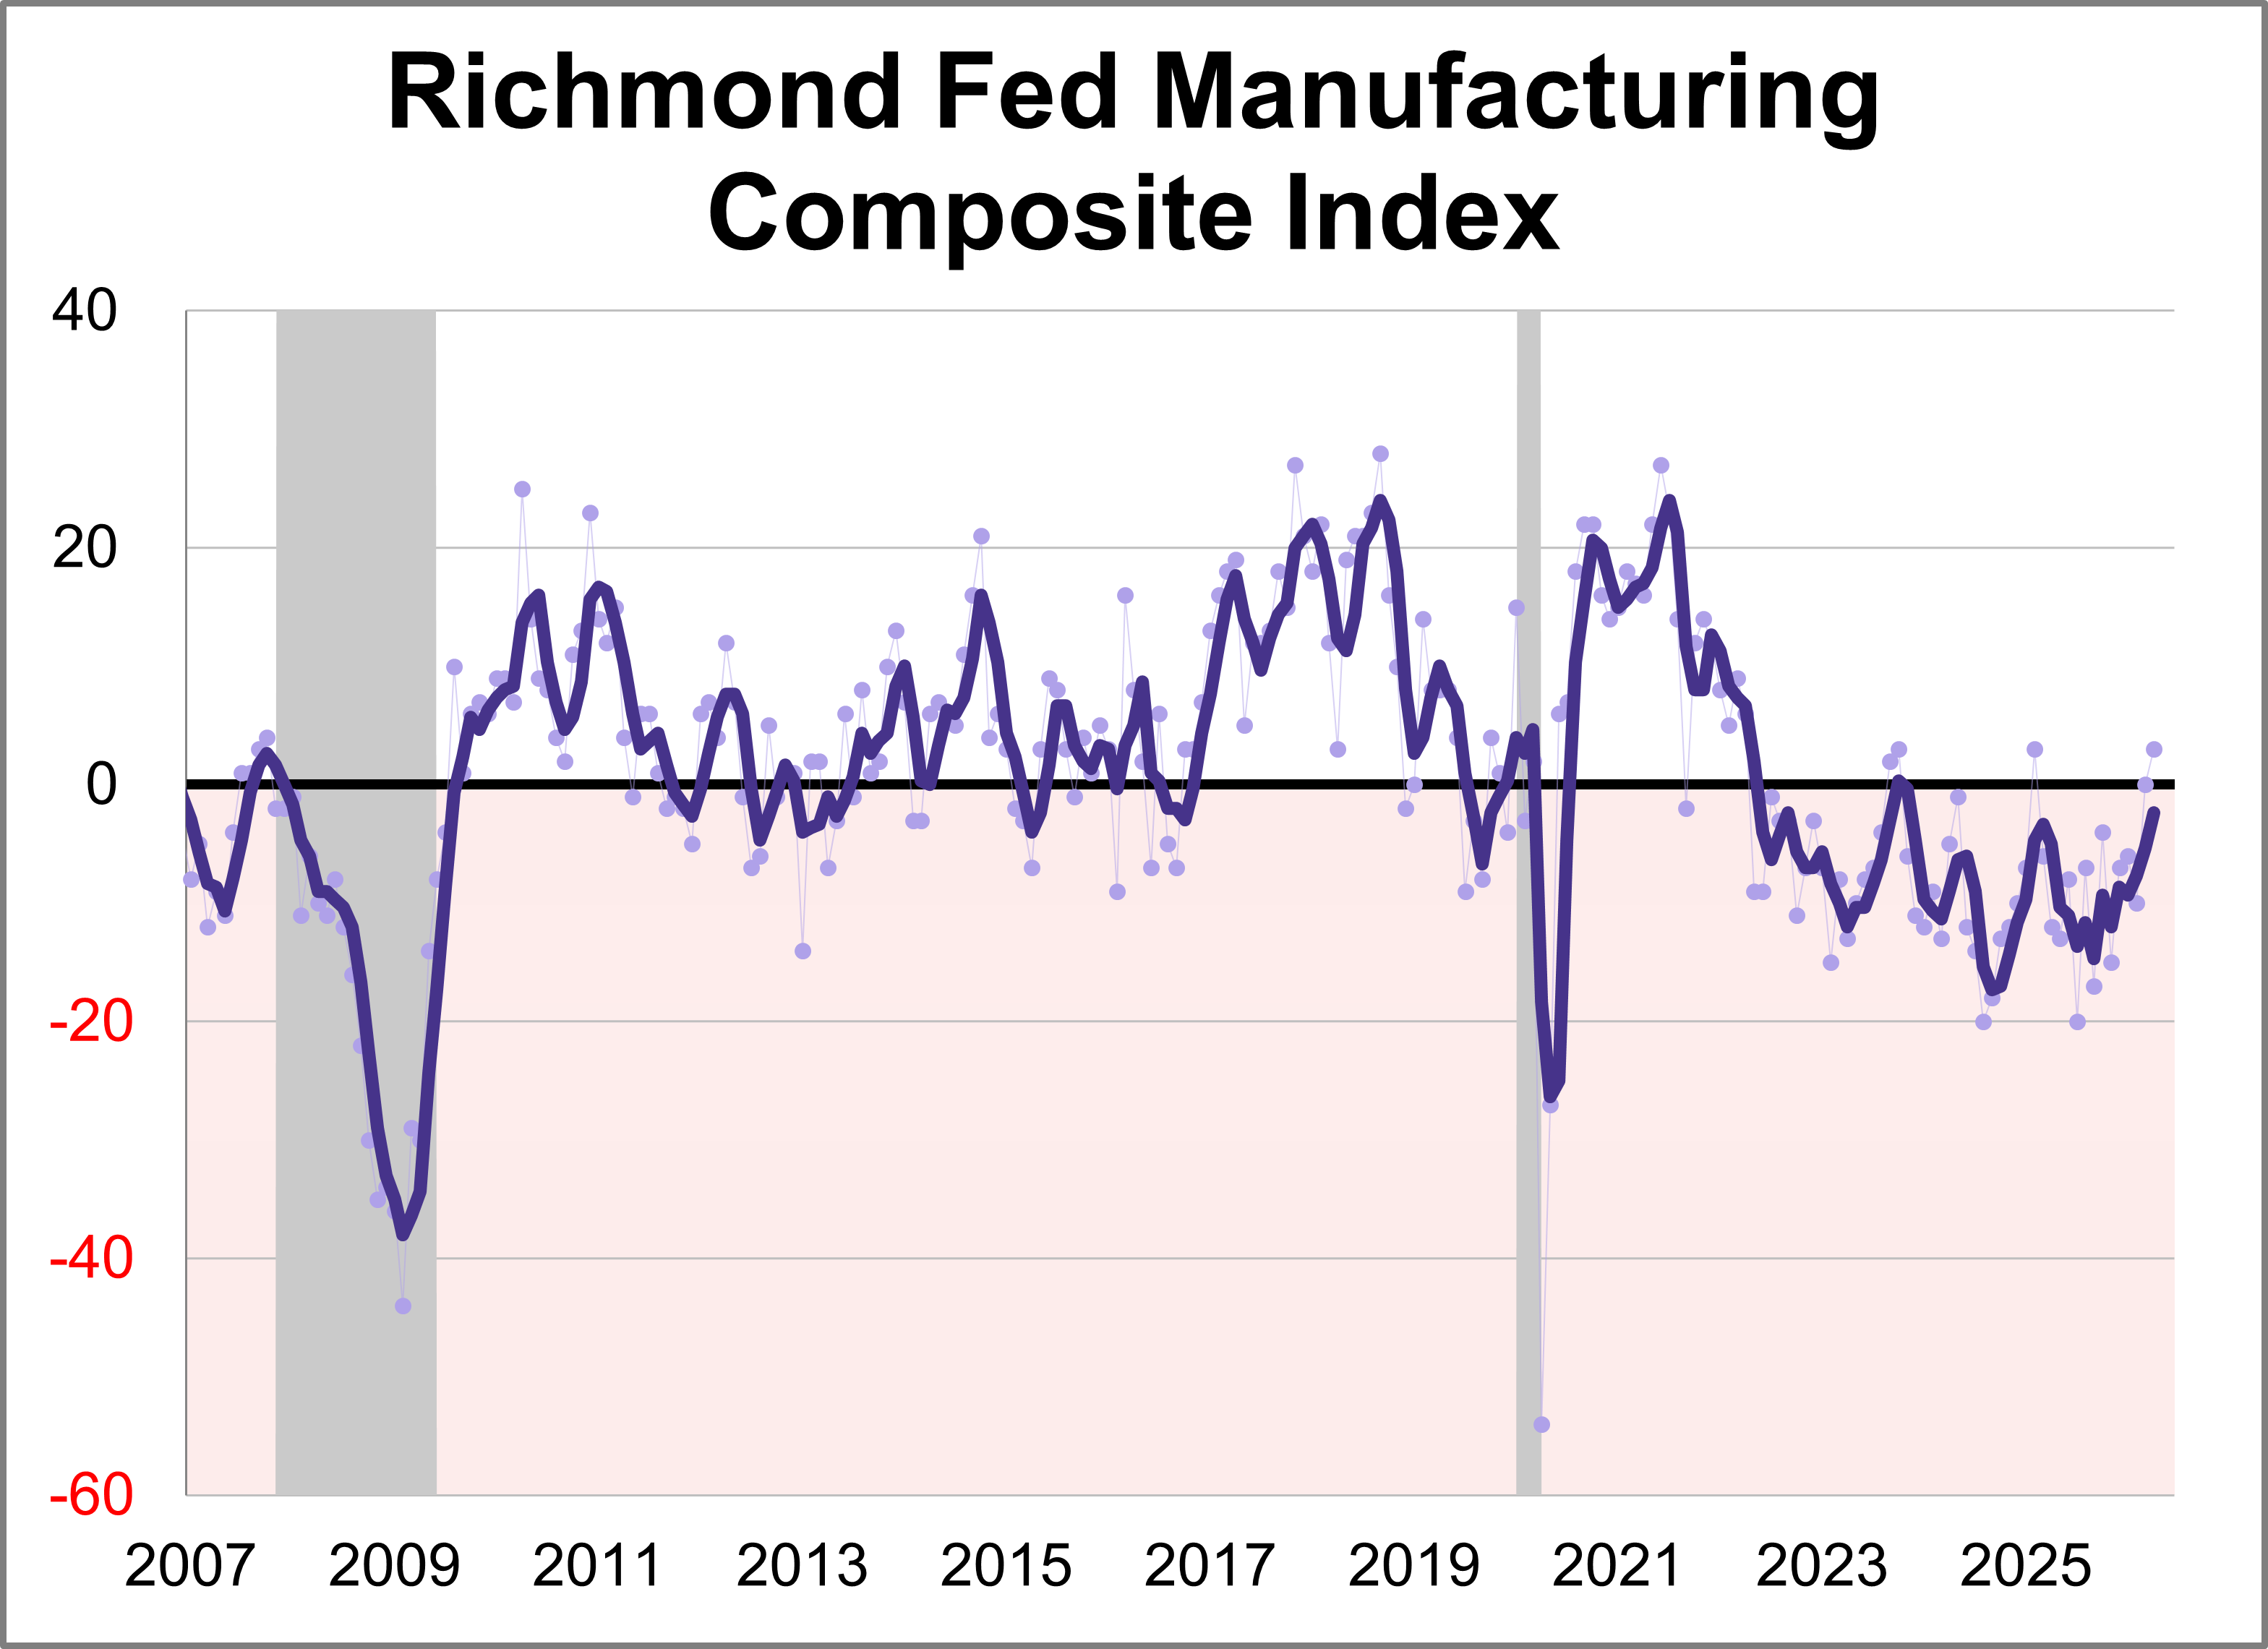
Fifth district manufacturing activity increased in April according to the most recent survey from the Federal Reserve Bank of Richmond. The composite manufacturing index rose three points points to 3, marking the highest level for the index in 20 months. This month's reading was above the forecast of 2.
Last week’s economic data was defined by conflicting signals from the consumer. While retail figures suggest resilience, sentiment levels have plummeted to record lows. Meanwhile, the S&P 500 continued its historic rally as markets prepare for the upcoming Fed decision.
Active ETFs are no longer a niche satellite play; they are becoming central pillars of modern portfolio construction.
Travel on all roads and streets increased in February. The 12-month moving average was up 0.19% month-over-month and was up 1.07% year-over-year. However, if we factor in population growth, the 12-month MA of the civilian population-adjusted data (age 16-and-over) was up 0.16% month-over-month and up 0.36% year-over-year.
While recent market performance reflects optimism over potential geopolitical de-escalation, underlying economic data reveals a complex landscape of intensifying price pressures and cooling growth. This article examines the major economic news from the week of April 6-10th, 2026.
While recent market performance reflects optimism over potential geopolitical de-escalation, underlying economic data reveals a complex landscape of intensifying price pressures and cooling growth.
The traditional 60/40 portfolio is undergoing a structural renovation, but the fixed income sleeve is proving difficult to stabilize.